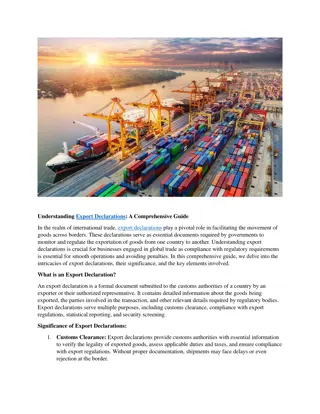
China's Export Growth and Rising Robot Market: Trends and Insights
Discover the significant growth of China's exports and the booming robot market in this insightful study. Explore the impact of robot imports on the economy and the shift towards automation in manufacturing. Stay informed on the latest trends shaping China's economic landscape.

Download Presentation

Please find below an Image/Link to download the presentation.
The content on the website is provided AS IS for your information and personal use only. It may not be sold, licensed, or shared on other websites without obtaining consent from the author. If you encounter any issues during the download, it is possible that the publisher has removed the file from their server.
You are allowed to download the files provided on this website for personal or commercial use, subject to the condition that they are used lawfully. All files are the property of their respective owners.
The content on the website is provided AS IS for your information and personal use only. It may not be sold, licensed, or shared on other websites without obtaining consent from the author.
E N D
Presentation Transcript
Robot Use and Export Upgrading Xiaoying Li (Sun Yat-sen Univ.) Qiren Liu (Guangzhou Univ.) Richard B. Freeman (Harvard Univ.) Harvard China Economy Seminar, Econ of S&E Seminar Feb. 3, 2021
China's export and import (100million USD) China s Export 30000 25000 Export growth has been a major component supporting China's rapid economic expansion The value of goods exported from China grew immensely from 1999 to 2019. In 2019, China led the world in exports, exported approximately 2.5 trillion USD, followed by the U.S., with exports valued at 1.64 trillion USD, and Germany with exports valued at 1.49 trillion USD. China Export and import rebounded quickly after the serious hit of Covid19 in Jan.- Mar. 2020 20000 15000 10000 5000 0 2000 2005 2010 1999 2001 2002 2003 2004 2006 2007 2008 2009 2011 2012 2013 2014 2015 2016 2017 2018 2019 export import net surplus Figure 1a: China s export and import, from Chinese Custom statistics Year on Year growth rate after Covid19: % 30 20 14.510.9 11.28.2 10 10 7.7 7.2 4 1.2 0 -1.5 -3.8 -10 -20 -30 -39.8 -40 -50 export import Figure 1b: China s export and import after Covid19, from Chinese Custom statistics
Rising Robots Robots have been widely adopted by firms worldwide. Robots were first introduced to China in the early 2000, and with its fast rising of robot use, China has been the biggest and fast growing robot market worldwide regarding annual sales since 2016. China does not produce a meaningful quantity of robotics hardware domestically until 2013 and consequently firms import robots from foreign producers almost completely before 2013 (see figure 1). In 2020, majority of new robots (around 70%) in China are shipped from foreign suppliers Annual supply of industrial robots in China (1000 of units) 100.0 90.0 80.0 27 70.0 60.0 20.4 50.0 16 40.0 9 30.0 41.1 48.1 60 20.0 0.7 0.5 1.5 3 4.5 5.8 6.6 7.9 5.5 15.0 22.6 23.0 27.6 2001 10.0 0.0 2002 2003 2004 2005 2006 2007 2008 2009 2010 2011 2012 2013 2014 2015 2016 foreign supply domestic supply Figure 2: supply of industrial robots in China Notes: IFR data
Unique product level data Annual Robot Imports: 1000 units Combine robot imports with product export Product level data from Chinese Custom, where we can see the imports of robots and the exports of products for robotized and non-robotized firm. Robot imports: We define robots imports including: industrial robots for multiple use, industrial robots,industrial bellows,handling robot, automated material handing machines used in factories, Automatic butt welding machinery( ,Arc including plasma arc welding robot, high frequency plastic welding machine etc. The actual robots imports only include three types by 8digit HS code: Industrial robots for multiple uses Other industrial robots Automated material handing machines used in IC factories Compare our robot measure to data reported by the Industrial Federation of Robots (IFR), and find both measures are comparable, showing similar 45.0 39.3 39.9 36.8 40.0 35.0 27.6 30.0 22.6 23.0 23.3 25.0 20.0 15.0 4.1 6.4 9.4 10.1 10.1 10.2 10.2 11.4 12.1 15.0 0.7 0.5 1.5 3.5 4.5 5.8 6.6 7.9 5.5 10.0 5.0 0.0 2010 2001 2002 2003 2004 2005 2006 2007 2008 2009 2011 2012 2013 robots imports from IFR data robots imports from Custom data Figure 3: China s robot imports from IFR data and Custom data Notes: data from China s Custom Data and IFR data
Robot units imported by country 2000 to 2013 Robot resources The top 6 countries from which China imported robots are Japan (1st), Taiwan of China (2nd), South Korea (3rd), Germany (4th), Sweden (5th), and United States (6th). 72% comes from Japan, 7% comes from Taiwan province of China, 4% comes from South Korea,Germany and Sweden respectively, and 1% from United States The robot prices varies by country by types: Robots from Germany and Sweden are more Robot used in IC factories are only imported from Sweden. Robot for multiple uses are generally more expensive. The price difference from Europe among robots types are smaller than the price difference among robots from Asian countries. Potential proxy for robot quality 120000 100000 80000 60000 40000 20000 0 Japan Taiwan South Korea sweden Germany United States 84795010 Industrial robots multiple uses 84795090 Other industrial robots 84864031 Automated material handing machines used in IC factories Figure 4a: China s robot imports by countries Unit price by country (RMB) 200000 150000 100000 50000 0 Japan Taiwan South Korea sweden Germany United States 84795010 Industrial robots multiple uses 84795090 Other industrial robots 84864031 Automated material handing machines used in IC factories Figure 4b: prices of robot imports by countries
Robot use by industry five industries that robots are most widely used in 2012 China has become both the world's largest car markets and the world s largest production sites for cars including electric cars. Up to 2015, automotive industry in China has largely boosted robot installations. China is also a major production market for electronic devices, batteries, semiconductors and chips. In 2016, the electrical/electronics industry replaced the automotive industry as the most important customer of industrial robots in China and the main driver of the growth. 35000 30460 30000 25000 20000 15000 11538 11189 10454 7779 10000 5000 0 Figure 5: the five industry uses the most robots in China in 2012
Existing literature Trade liberalization can help developing countries to obtain higher quality intermediate inputs, thereby promoting the quality of export products(Kugler & Verhoogen, 2012; Fan et al., 2015; and Bas & Strauss-Kahn, 2015) importing capital and machines on product upgrading and exporting upgrading (Dijankov and Hoekman,1996, 1997) Mody and Yilmaz (2001) looks at the impact of imported equipment of countries export competitiveness, using an aggregate export price index. Navaretti et al., (2004) find that imported technologies do have an effect on the quality upgrading of the exported products: integration of EU and its effect on textile.
The economic effects of technological changes. ICT or related technologies, and gains at the firm level (Basker, 2012; Bloom, Sadun, and Van Reenen, 2012) Robots effects on employment and wages: mostly negative effects (Acemoglu and Restrepo, 2017; Frey and Osborne, 2013; Brynjolfssson and McAfee, 2014), increased job opportunities, and employment overall(Alexopoulos and Cohen ,2016) ; mixed, sector spillover, (Autor and Salomons, 2017; Dauth et al. ,2017) Relied upon much coarser data at the industry or geographic region level (Graetz and Michaels 2015 , Mann and P ttmann 2017). Firm-level analysis : Dixon, et al., (2019) get Evidence from Canada that robot adoption instead associated with an increase in the strategic importance of improving product and service quality Acemoglu et al. (2020) study firm-level changes associated with robot adoption using data from France between 2010 and 2015 and find that robot adopters experience significant declines in labor share and the share of production workers in employment, and increases in value added and productivity Bonfiglioli, Alessandra, et al (2020) use French data over the period 1994-2013 to study how imports of industrial robots affect firm level outcomes.
Some clue from establishment survey data In the dataset of robot use in South China s coastal areas for 600 establishments, it shows that around 50% of the surveyed establishments have adopted robots in 2018. The first purposes of using robots mainly fall into three categories: 48% of them using robots to improve productivity and reduce defect rate, 40% of them using robots to reduce labor costs, 12% using robots in severe environment and heavy workloads. After adopting robots, 60% see significant drop of defect rates.
Data We combine the establishments by name, zip code, and telephone number in CCTS with those in ASIE. Transaction data from the Chinese Customs Trade Statistics (CCTS) database, which is compiled by the General Administration of Customs of China. product level imports and exports at the 8-digit HS code. It records the value, quantity, export destination country, trade types, and basic information of the company. The second data, i.e. Annual Survey of Industrial Enterprise in China (ASIE)contains basic information of enterprises company names, postal codes, telephone numbers, and financial information of enterprises such as labor cost, employment, capital investment, capital stock, intermediate investment, industrial output value, and industrial added value. Table 1: sample lose number of products After merge number of establishments Before merge year Before merge After/ before After merge After/ before 2000 4967 4204 84.64% 62 770 19029 30.32% 2001 4947 4242 85.75% 68 487 21788 31.81% 2002 4891 4328 88.49% 78 572 25225 32.10% 2003 4898 4399 89.81% 95 631 29201 30.54% 2004 4880 4512 92.46% 120 362 45425 37.74% 2005 4894 4537 92.71% 143 514 47583 33.16% 2006 4893 4580 93.60% 170 686 54590 31.98% 2007 4612 4278 92.76% 192 512 57316 29.77% 2008 4570 4264 93.30% 205 524 71276 34.68% 2009 4567 4233 92.69% 215 220 63458 29.49% 2010 4571 4250 92.98% 233 340 69106 29.62% 2011 4562 4230 92.72% 253 568 67427 26.59% 2012 4526 4106 90.72% 269 023 39538 14.70% 2013 4536 4106 90.52% 281 840 36819 13.06%
Robot variable We define robot use by importing robots. We assume manufacturing establishments import robots mainly for self use. Robot dummy, whether the enterprise use the robot ever, according to the robot importing history, yes=1, no=0 robot value, robot units, robot price, robot density After 2013, more domestically produced robots replace the importing robots. Considering the above issues and the impact of China's accession to the WTO (2002-2004 import tariff reduction), we selected the 2006-2012 "enterprise- HS6 product-destination-year" high-dimensional panel data for analysis.
Summary statistics (1) Robotized establishments generally product products with high exported amount, exported value, higher wages, more diversification,, and the quality of products are higher. Table 2a: summary statistics for dependent variables 2006-2012 Mean all sample Dependent variables (defined at product level) export quantity (1million) export value(1million yuan) Log price number of export products number of exported destinations quality_Broda quality_2SLS quality_agg Obs. non- robotized diff 4.9 7.7 2.0 6.4 9.0 0.6 1.1 1.9 636125 robotized 20.8 44.8 2.9 11.2 11.5 0.7 1.7 3.2 11656 SD 44.5 46.7 2.2 10.1 11.2 2.8 89.7 7.6 min 0 0 -12.7 1 1 -51.7 -15758.8 -83.1 647,492 max 2140.0 2140.0 20.1 659.0 189.0 50.0 15771.3 95.6 15.9 37.1 0.9 4.8 2.5 0.2 0.5 1.4 Notes: the variables are calculated at product level
Summary statistics (2) From 2006 to 2012, robot coverage rise, together with dramatic increase of robot values, robot density; meanwhile, export performance improved . Table 2b: dynamic changes for variables 2006 2007 2008 2009 2010 2011 2012 Robot related variable are defined at Establishment level Robot use robot_value/ 1000workers 13812 13633 14806 17709 38138 142193 - robot_units/1000workers 0.66 0.63 3.01% 3.18% 3.25% 3.44% 3.64% 3.64% 3.64% 0.67 0.69 1.94 5.05 - Log price_robot 0.28 0.30 0.31 0.33 0.35 0.39 0.40 Outcome variables are defined at Product level export quantity (1million) export value(1million yuan) 7.8 number of export products 6.6 number of exported destinations 5.2 5.0 7.9 6.4 4.9 8.1 6.2 4.4 7.0 6.2 4.8 8.6 6.5 4.9 9.6 6.5 6.2 15.0 7.3 9.0 9.0 9.1 9.1 9.5 9.7 11.6
Demand and product quality According to Hallak & Sivadasan 2013 ,we set the demand function for products as follows: q p = E 1 (1) i i i 1- P q p and stands for quantity, price, and quality and in practice can be reflected by price elasticity E and P stands for expenditure and price index with E given, P can be calculated as the following ( ) 1 1- 1 1 i i = P p di (2) i Khandelwal et al. (2013) deduce quality index by moving the price and quantity to the left of the equation, with the elasticity assigned, and further controlling year, destination, and firm effects ???????+ ? ???????= ??+ ???+ ?????(3) Broda et al. 2006 calculated for HS3products, and deduce the product quality from residual of equation (3), which includes factors which increase either quantity or price other than Xj, and Xdt. More recently, improved 2sls are used to estimate , and through different , we get different measure of product quality, such as quality_2sls, quality_agg
Chinas export quality rise after 2008 Export product quality: log(price)+sigma_u*log(quantity) we calculate the export quality from 2001 to 2013. From 2001 to 2007, the export quality stagnated. From 2008 to 2013, export quality keeps rising. 8.00E+00 7.00E+00 6.00E+00 5.00E+00 4.00E+00 3.00E+00 2.00E+00 1.00E+00 0.00E+00 -1.00E+00 quality_Broda quality_agg quality_2SLS log_price Figure 6: export quality trends
Demand shifts with robotized products (1) (1)all samples (3) homo goods (2) diff goods 5 4 5 Quality is expensive to produce, a rise in export price may be associated with an increase in demand two sub-samples: firm that adopts robots in producing products; firms that does not adopt robot technology. Based on the log(quantity) and log(price) data, we get the demand curve for robotized and non-robotized firms. green line is demand curve of robotized firms; red line is the demand curve for non- robotized firms. 2 0 0 0 -2 -5 -5 -4 0 5 10 quantity_ln 15 20 25 0 5 10 quantity_ln 15 20 25 0 5 10 quantity_ln 15 20 25 95% CI 95% CI Fitted values Fitted values 95% CI 95% CI Fitted values Fitted values 95% CI 95% CI Fitted values Fitted values (4) SOE firms 5 (5) non- SOE firms 5 0 0 -5 -5 0 5 10 quantity_ln 15 20 25 0 5 10 quantity_ln 15 20 25 95% CI 95% CI Fitted values Fitted values 95% CI 95% CI Fitted values Fitted values Figure 7a: demand curves of different types of products and ownership for robotized V.S. non-robotized firms
Demand shifts with robotized products (2) (1) automotives (2) electronics By industry Green line is demand curve of robotized firms; red line is the demand curve for non- robotized firms. (3) metal (4) plastics Figure 7b: demand curves of four industries: robotized V.S. non- robotized firms
Empirical model ?????= ??+ ?????????+ ????+ ????+ ????+ ?????(2) f, p, d and t refer to firm, product, destination country of export, and year. Y variable: log quantity, log sales(yuan), log price=sale/quantity, log product quality (i.e. quality_Broda) Diversification: log number of product, log number of export destinations X: Capital to labor ratio, SOE, log capital value, log intermediate value Fixed effects including ????(the interaction of product, destination country and firm fixed effects), ????(the interaction of export product, destination countries and year fixed effects). is the error turn.
Demand functions Table 3: robot on demand function 1 2 3 4 5 6 7 VARIABLES Log Quantity plastic and chemical -0.590*** (0.016) -0.065 (0.093) sample Log Price all diff homo -0.325*** (0.015) -0.062 (0.107) automotive -0.509*** (0.022) 0.198 (0.165) electrical -0.549*** (0.005) -0.051 (0.038) metal -0.654*** (0.021) 0.110 (0.135) -0.551*** (0.003) -0.043* (0.024) -0.558*** (0.003) -0.051** (0.025) robot Log price* robot 0.024*** (0.006) 0.151*** (0.004) 0.013*** (0.003) -0.080** (0.040) 0.015*** (0.001) 0.113*** (0.002) 6.289*** (0.038) 0.026*** (0.006) 0.156*** (0.004) 0.013*** (0.003) -0.088** (0.042) 0.016*** (0.001) 0.115*** (0.002) 6.208*** (0.040) 0.012 (0.043) 0.092*** (0.019) 0.012 (0.013) 0.111 (0.166) 0.005 (0.003) 0.073*** (0.007) 7.490*** (0.156) -0.007 (0.029) 0.126*** (0.033) 0.027 (0.029) -0.251 (0.201) -0.014** (0.007) 0.075*** (0.011) 6.855*** (0.309) 0.030*** (0.010) 0.251*** (0.009) 0.035*** (0.004) 0.081 (0.087) 0.032*** (0.002) 0.154*** (0.003) 4.484*** (0.076) 0.077 (0.048) 0.183*** (0.029) -0.001 (0.012) 0.001 (0.523) 0.004 (0.004) 0.068*** (0.008) 7.708*** (0.198) -0.017 (0.028) 0.174*** (0.021) -0.006 (0.012) -0.471*** (0.087) -0.004 (0.003) 0.173*** (0.009) 6.348*** (0.181) lnQ Robotized: Lower price elasticity Employee size Capital to labor ratio SOE Non- robotized Log capital value lnP Log intermediate value Constant FEs Y Y Y Y Y Y Y Observations R-squared 2,692,488 0.900 2,374,167 0.899 149,363 0.921 54,352 0.911 980,991 0.891 98,925 0.916 184,011 0.907
Exports performance Table 3: robot on export performance at product level 1 2 3 4 (quality_Broda)= lnQ+sigma*lnP on controls Log exported Quantity Log exported Price Log sales= (lnQ+lnP) Establishments using robots generally (1) export more quantity, (2)with higher prices, (3) the total value of exports are higher (4)the quality of exported products are higher VARIABLES Robot 0.117* (0.067) 0.363*** (0.015) 0.029*** (0.009) -0.304* (0.180) 0.021*** (0.003) 0.232*** (0.006) 7.225*** (0.117) 146,208 0.886 0.015* (0.008) -0.009*** (0.002) 0.003*** (0.001) -0.005 (0.018) 0.001** (0.000) 0.007*** (0.001) 2.348*** (0.016) 2,692,488 0.959 0.096** (0.049) 0.340*** (0.012) 0.039*** (0.007) -0.381*** (0.126) 0.028*** (0.002) 0.243*** (0.005) 9.180*** (0.094) 146,332 0.862 0.038* (0.021) 0.088*** (0.005) 0.011*** (0.003) -0.148*** (0.057) 0.008*** (0.001) 0.079*** (0.002) -0.574*** (0.043) 2,683,548 0.881 Employee size Capital to labor ratio SOE Log capital value Log intermediate value Constant Observations R-squared
Selection Bias? Matching + DID Establishments with better export performance might be more likely to use robots, which causes positive selection bias. First, we do propensity score matching to get the clone samples Then, we use dynamic difference in difference method to get casual effects Control group: establishments do not use robots Treated group: establishments change from not using robots to using robots We further divide them into 3 subsamples: 1st is the subgroup just when they begin to use robots, 2nd is the subgroup one year after using robots, 3rd is the subgroup two years after using robots. use use no use no Robot Use Treatment time t t-1 t+1 t+2 t-2 no no no no no Robot Use Control t+2 t t-1 t+1 t-2 time
Matching details We use the covariates in period t-1 and t-2 to do the matching, i.e. lag quality_Broda, lag quality_2SLS, lag log price_ln, lag2 quality_Broda, lag2 quality_2SLS, lag2 price_ln We use non-parametric matching method, coarsened exact matching(CEM ) to do 1 to 1match according to Iacus et al.(2011). After CEM, we can t reject the trend are mean equal, which show the common trend before robot adoption. Table 4: matching balance table Before matching T Mean CEM C No. C No. T Mean T No. C Mean. p T No. C Mean. p quality_Brodat-1 quality_Brodat-2 quality_Broda quality_2SLSt-1 quality_2SLSt-2 quality_2SLS quality_aggt-1 quality_aggt-2 quality_agg price_lnt-1 price_lnt-2 price_ln 15595 9956 8499 15333 9836 8351 15333 9836 8351 15600 9993 8501 1.83 1.69 0.17 2.20 2.19 0.28 3.89 3.86 0.27 2.61 2.51 0.04 6339827 4379076 3723172 6284891 4348139 3692366 6284943 4348180 3692401 6366100 4397765 3738989 1.02 1.14 -0.02 1.98 2.15 0.03 2.56 2.67 0.09 1.96 1.92 0.07 0.00 0.00 0.00 0.78 0.97 0.66 0.00 0.00 0.00 0.00 0.00 0.00 7862 4067 3659 7755 4059 3642 7755 4059 3642 7881 4091 3673 1.50 1.42 0.09 2.17 2.17 0.33 3.80 3.60 0.20 2.65 2.43 0.04 8261 4259 4090 8179 4248 4079 8179 4248 4079 8300 4289 4120 1.51 1.49 0.07 1.98 2.16 0.01 3.54 3.60 0.10 2.27 2.12 0.02 0.92 0.21 0.63 0.34 0.98 0.28 0.04 0.98 0.21 0.00 0.00 0.25
(1) (2) Dynamic DID Dynamic effect on product quality are presented in graph (1) to (3), we see divergent tread of quality changes for robotized and non robotized groups; Dynamic effects on price are presented in graph (4) and the effect is insignificant. (4) (3) Figure 8: dynamic effects of robot use on export quality and price Notes: green line is treated group and red line is control group
Table 5 dynamic DID results Match+DID regressions exp_quantity_ln t+1 0.317*** (0.078) 103,460 0.923 exp_value_ln t+1 0.260*** (0.060) 103,550 0.912 quality_Broda t+1 0.108*** (0.035) 891,731 0.936 price_ln t+1 -0.006 (0.014) 895,087 0.973 t t+2 robot 0.264*** (0.060) 103,621 0.924 0.401*** (0.097) 103,338 0.923 Table 3 shows the empirical results after using matching methodology. It shows that in the matched sample, we still find establishments using robots (1) export larger export quantity, (2) the values of exports are higher, (3) product quality are higher, (4) the price of export do not show significant difference For the first three effects the effect become larger with time become longer. Observations R-squared t t+2 robot 0.230*** (0.050) 103,713 0.912 0.316*** (0.075) 103,424 0.911 Observations R-squared t t+2 robot 0.091*** (0.025) 898,750 0.936 0.114** (0.044) 888,057 0.936 Observations R-squared t t+2 -0.002 (0.016) 891,408 0.973 robot -0.006 (0.009) 902,100 0.973 Observations R-squared
Endogenous problem Endogenous problems caused by reverse causal relations and omitted variables. Following Acemoglu (2013), Acemoglu and Restrepo(2018), we use IV low2_EU=robot by industry in EU* low skill ratio (calculate from 2004 economic census, and define low skill by workers with high school and below education). Robots use in European countries in a particular industry will affect robot use in the same industry in China, but will not affect product quality in China through ways other than robot use. low skill labor intensive industries are more likely to use robot to replace labor Table 6 instrument variables estimation (1) quality_Broda 10.379*** (2) (3) (4) VARIABLES robot Log price 7.098** 0.492 -0.086 (3.857) (3.172) -0.808*** (1.344) (1.226) -0.126*** pr_match (0.082) 2,779,777 (0.031) 2,788,648 Obs. 2,781,592 2,790,463 R-squared IV -0.242 low2_EU -0.111 low2_EU -0.003 low2_EU 0.000 low2_EU N_clust 795247 794648 797754 797155
Homo V.S. diff products According to Rauch 1999 ,products can be classified into homogenous products and differentiated products according to publicity of product prices. Rauch divides products in international trade into three categories based on SITC codes: exchange-traded products, products with reference prices, and other products. Exchange-traded products and products with reference prices can be classified as homogenized products, such as lead (SITC685) traded on exchanges and polymerization and copolymer products (SITC583) with reference prices in the "Chemical Market Report"; Products whose reference prices are not found publicly can be classified as differentiated products, such as footwear products (SITC851). Homogeneous goods compete in a more competitive market, while differentiated goods usually competes in a monopolistic market Homo products Diff products SITC Exchange-traded products products with reference prices other products 62 9.52% 185 28.42% HS3 404 62.06%
Heterogeneous effects For homogenous goods, robot use have little effects on both quality and price, . For differentiated goods, robot use mostly increase the quality ( more likely to through the wage of rising quantity), but not increase the price. Table 7 heterogeneous effects of robots quality_Broda matching DID t 0.100*** 0.132*** 0.139*** -0.027 -0.038 798,043 791,827 0.937 0.936 diff diff t t+1 -0.04 0.016 -0.084 -0.096 43,776 43,529 0.928 0.929 homo homo price_ln matching DID t t+1 0 0.007 -0.01 -0.014 OLS OLS t+1 t+2 t+2 0.013 -0.017 robot 0.043* -0.023 2,365,227 0.881 diff OLS -0.045 -0.055 149,363 0.88 homo 0.020** -0.008 2,374,167 801,393 795,183 791,816 0.961 0.974 diff diff OLS t -0.022 -0.057 -0.045 -0.07 149,363 43,776 0.929 0.957 homo homo -0.049 788,465 0.936 diff t+2 0.048 -0.122 43,450 0.929 homo Obs. R-squared sample 0.974 diff t+1 -0.035 -0.076 43,529 0.958 homo 0.974 diff t+2 0.059 -0.101 43,450 0.958 homo robot Obs. R-squared sample
Export Diversification Table 8: External margins of robots on exports VARIABLES Log number of products match+DID t Diversifications of products and diversifications of exported destinations leads to larger export market This section will explore the effects of robot use on export to external margins such as types of products exported, and number of destination countries. OLS t+1 t+2 Robot 0.141*** 0.108*** 0.191*** 0.197*** (0.026) (0.024) Observations 146,521 103,848 103,687 103,564 R-squared 0.822 0.852 (0.031) (0.039) 0.852 0.852 VARIABLES Log number of destinations OLS t t+1 t+2 Robot 0.033 (0.023) 0.065*** 0.111*** 0.127*** (0.022) (0.027) (0.033) Observations 146,521 103,848 103,687 103,564 R-squared 0.879 0.905 0.905 0.905
Table 9a: replace measures of robots use and product quality Robustness (1) robot_density (robot/worker) (4) X:different measures of robots Y: coefficients of x Log robot_ Stock (1) Log robot value (2) Log robot Price (3) Replace robot dummy by different measures in all regressions for different dependent variables (1) log robot units in an establishments (2) log robot value in an establishments (3) log robot price (4) robot density which is defined as the percentage of robot units per worker More robots, using robots of high price, and higher robot density are all have positive effects on export performance exp_quantity_ln 0.013** (0.006) 146,208 0.886 exp_value_ln 0.011** (0.005) 146,332 0.862 quality_Broda 0.006*** (0.002) 2,683,548 2,683,548 0.881 price_ln 0.001* (0.001) 2,692,488 2,692,488 0.959 0.071* (0.037) 146,208 0.886 0.015** (0.007) 146,208 0.886 0.191** (0.081) 8,310 0.891 Observations R-squared Y: coefficients of x 0.069*** (0.026) 146,332 0.862 0.011** (0.005) 146,332 0.862 0.111*** (0.041) 8,285 0.889 Observations R-squared Y: coefficients of x 0.056*** (0.011) 2,683,548 0.881 0.005** (0.002) 0.153*** (0.034) 2,683,548 0.881 Observations R-squared 0.881 Y: coefficients of x 0.008** (0.004) 2,692,488 0.959 0.001* (0.001) 0.020 (0.013) 2,692,488 0.959 Observations R-squared 0.959
Robustness (2) Replace robot dummy by different measures in all regressions for different dependent variables (1) log robot units in an establishments (2) log robot value in an establishments (3) log robot price (4) robot density which is defined as the percentage of robot units per worker More robots, using robots of high price, and higher robot density are all have positive effects on export diversifications Table 9b: replace measures of robots use and product quality robot_density (robot/worker) (4) X:different measures of robots Y: coefficients of x Log robot_ Stock (1) Log robot value (2) exp_product_n_ln 0.098*** 0.014*** 0.014*** (0.014) (0.002) 146,521 146,521 0.823 0.822 exp_country_n_ln 0.036*** 0.004* (0.011) (0.002) 146,521 146,521 0.879 0.879 Log robot Price (3) 0.038 (0.030) 8,332 0.832 (0.003) 146,521 0.822 Observations R-squared Y: coefficients of x 0.004 (0.002) 146,521 0.879 0.017 (0.025) 146,521 0.879 Observations R-squared
Conclusions Robot adoption has positive effects on the demand of exported products, which are mostly reflected in the rising export quantity, export value, as well as product quality, but less in the product price. For differentiated goods, robots use will raise its demand, quantity as well as quality, but for homogenous goods, robot use has insignificant on total demand, export value, export quantity or price.. Robot adoption will increase export diversification in terms of more categories of products, as well as the more exporting destinations. The dynamic effects of robots on exports last and accumulate for more than one periods.
Thanks for listening! Any advice will be appreciated!


")
")


")


")


")