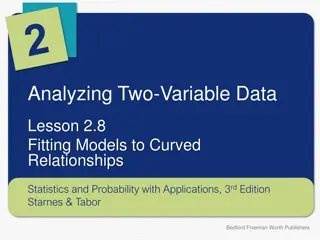
Explore the selection of models - linear, quadratic, and exponential - for various data sets through graphing and analysis. Determine the best-fit function for given points, differences, and real-world data scenarios. Equations are derived to model the data effectively.
Please find below an Image/Link to download the presentation.
The content on the website is provided AS IS for your information and personal use only. It may not be sold, licensed, or shared on other websites without obtaining consent from the author. If you encounter any issues during the download, it is possible that the publisher has removed the file from their server.
You are allowed to download the files provided on this website for personal or commercial use, subject to the condition that they are used lawfully. All files are the property of their respective owners.
The content on the website is provided AS IS for your information and personal use only. It may not be sold, licensed, or shared on other websites without obtaining consent from the author.
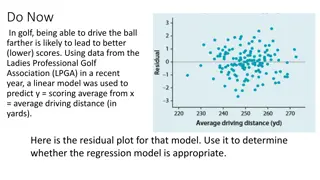
Problem 3: Modeling Real-World Data The data below gives the value of a used car over time. Which type of function best models the data? Write an equation to model the data.