Chronic Kidney Disease Data Report 2017
Chronic Kidney Disease (CKD) data report for the year 2017, including information on CKD stages, prevalence, eGFR distribution, and urine albumin/creatinine ratio among NHANES participants. The report presents detailed insights into CKD in the general population based on the KDOQI CKD staging guidelines.

Download Presentation

Please find below an Image/Link to download the presentation.
The content on the website is provided AS IS for your information and personal use only. It may not be sold, licensed, or shared on other websites without obtaining consent from the author.If you encounter any issues during the download, it is possible that the publisher has removed the file from their server.
You are allowed to download the files provided on this website for personal or commercial use, subject to the condition that they are used lawfully. All files are the property of their respective owners.
The content on the website is provided AS IS for your information and personal use only. It may not be sold, licensed, or shared on other websites without obtaining consent from the author.
E N D
Presentation Transcript
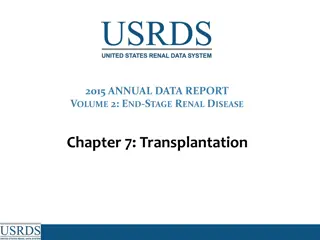
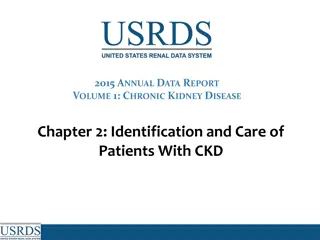
2017 ANNUAL DATA REPORT VOLUME 1: CHRONIC KIDNEY DISEASE Chapter 1: CKD in the General Population
Table A Kidney Disease Outcomes and Quality Improvement (KDOQI) CKD Staging Guidelines GFR (ml/min/1.73 m2) CKD Stage Description Kidney damage with normal or GFR Kidney damage with mild in GFR Moderate in GFR Severe in GFR Kidney failure 1 > 90 2 60-89 3 4 5 30-59 15-29 < 15 (or dialysis) 2017 Annual Data Report Volume 1 CKD, Chapter 1 2
vol 1 Figure 1.1 Prevalence of CKD by stage among NHANES participants, 1999-2014 Data Source: National Health and Nutrition Examination Survey (NHANES), 1999-2002, 2003-2006, 2007-2010 & 2011 2014 participants aged 20 & older. Whisker lines indicate 95% confidence intervals. Abbreviation: CKD, chronic kidney disease. 2017 Annual Data Report Volume 1 CKD, Chapter 1 3
vol 1 Figure 1.2 eGFR distribution among NHANES participants, 1999-2014 (a) All Individuals Data Source: National Health and Nutrition Examination Survey (NHANES), 1999-2014 participants aged 20 & older. Single-sample estimates of eGFR; eGFR calculated using the CKD-EPI equation. Abbreviations: eGFR, estimated glomerular filtration rate; SE, standard error. Accounts for change in serum creatinine assays. 2017 Annual Data Report Volume 1 CKD, Chapter 1 4
vol 1 Figure 1.2 eGFR distribution among NHANES participants, 1999-2014 (b) Individuals 60+ years Data Source: National Health and Nutrition Examination Survey (NHANES), 1999-2014 participants aged 20 & older. Single-sample estimates of eGFR; eGFR calculated using the CKD-EPI equation. Abbreviations: eGFR, estimated glomerular filtration rate; SE, standard error. Accounts for change in serum creatinine assays. 2017 Annual Data Report Volume 1 CKD, Chapter 1 5
vol 1 Figure 1.3 Urine albumin/creatinine ratio (ACR) distribution among NHANES participants, 1999-2014 Data Source: National Health and Nutrition Examination Survey (NHANES), 1999-2014 participants aged 20 & older. Single-sample estimates of ACR. Abbreviation: ACR, urine albumin (mg)/creatinine (g) ratio. 2017 Annual Data Report Volume 1 CKD, Chapter 1 6
vol 1 Figure 1.4 Percentage of NHANES (1999-2014) participants with ACR >30 mg/g, by eGFR category Data Source: National Health and Nutrition Examination Survey (NHANES), 1999-2014 participants aged 20 & older. Single-sample estimates of eGFR. Abbreviation: ACR, urine albumin (mg)/creatinine (g) ratio; eGFR, estimated glomerular filtration rate. 2017 Annual Data Report Volume 1 CKD, Chapter 1 7
vol 1 Table 1.1 Percentage of NHANES 2011-2014 participants, in the various CKD (eGFR and albuminuria) risk categories (KDIGO 2012) (a) Percentage in each category (2011-2014) Albuminuria categories A1 A2 A3 Normal to mildly increased Moderately increased Severely increased 30-300 mg/g 3-30 mg/mmol 4.3 2.6 >300 mg/g >30 mg/mmol 0.4 0.3 <30 mg/g <3 mg/mmol G1 G2 Normal to high Mildly decreased Mildly to moderately decreased Moderately to severely decreased Severely decreased Kidney failure 90 60-89 54.7 30.4 (ml/min/1.73 m2) GFR categories G3a 45-59 3.9 0.9 0.2 G3b 30-44 1.0 0.5 0.2 G4 15-29 0.1 0.1 0.2 G5 <15 <0.001 0.001 0.01 Data source: National Health and Nutrition Examination Survey (NHANES), 1999-2002, 2003-2006, 2007-2010 & 2011 2014 participants aged 20 and older. Single-sample estimates of eGFR and ACR; eGFR calculated using the CKD-EPI equation. Abbreviations: ACR, urine albumin/creatinine ratio; CKD, chronic kidney disease; eGFR, estimated glomerular filtration rate; GFR, glomerular filtration rate; KDIGO, Kidney Disease: Improving Global Outcomes CKD Work Group. Low risk: eGFR 60 ml/min/1.73 m2 and ACR <30 mg/g; moderately high risk: eGFR 45-59 ml/min/1.73 m2 or eGFR 60 ml/min/1.73 m2 and ACR 30-300 mg/g; high risk: eGFR 30-44 ml/min/1.73 m2 or eGFR 45-59 ml/min/1.73 m2 and ACR 30-300 mg/g or eGFR 60 ml/min/1.73 m2 and ACR >300 mg/g; very high risk: eGFR <30 ml/min/1.73 m2 or eGFR 30-44 ml/min/1.73 m2 and ACR 30-300 mg/g or eGFR 60 ml/min/1.73 m2 and ACR >300 mg/g. 2017 Annual Data Report Volume 1 CKD, Chapter 1 8
vol 1 Table 1.1 Percentage of NHANES 2011-2014 participants, in the various CKD (eGFR and albuminuria) risk categories (KDIGO 2012) Data source: National Health and Nutrition Examination Survey (NHANES), 1999-2002, 2003-2006, 2007-2010 & 2011 2014 participants aged 20 and older. Single-sample estimates of eGFR and ACR; eGFR calculated using the CKD-EPI equation. Abbreviations: ACR, urine albumin/creatinine ratio; CKD, chronic kidney disease; eGFR, estimated glomerular filtration rate; GFR, glomerular filtration rate; KDIGO, Kidney Disease: Improving Global Outcomes CKD Work Group. Low risk: eGFR 60 ml/min/1.73 m2 and ACR <30 mg/g; moderately high risk: eGFR 45-59 ml/min/1.73 m2 or eGFR 60 ml/min/1.73 m2 and ACR 30-300 mg/g; high risk: eGFR 30-44 ml/min/1.73 m2 or eGFR 45-59 ml/min/1.73 m2 and ACR 30-300 mg/g or eGFR 60 ml/min/1.73 m2 and ACR >300 mg/g; very high risk: eGFR <30 ml/min/1.73 m2 or eGFR 30-44 ml/min/1.73 m2 and ACR 30-300 mg/g or eGFR 60 ml/min/1.73 m2 and ACR >300 mg/g. 2017 Annual Data Report Volume 1 CKD, Chapter 1 9
vol 1 Table 1.2 Prevalence (%) of CKD in NHANES population within age, sex, race/ethnicity, & risk factor categories, 1999-2014 eGFR <60 ml/min/1.73m2 1999- 2002 2006 All CKD 2003- 2006 ACR 30 mg/g 2003- 2006 1999- 2002 2007- 2010 2011- 2014 2003- 2007- 2010 2011- 2014 1999- 2002 2007- 2010 2011- 2014 Age 20-39 40-59 60+ Sex Male Female Race/Ethnicity Non-Hispanic White Non-Hispanic Black/African American Mexican American Other Hispanic Other Non-Hispanic Risk Factor Diabetes Self-reported diabetes Hypertension Self-reported hypertension Self-reported cardiovascular disease Obesity (BMI >30) All 6.0 10.0 36.9 5.9 9.8 37.1 5.4 8.5 33.6 6.6 10.6 32.6 0.4 1.9 24.0 0.1 2.3 25.8 0.3 2.0 22.9 0.3 3.3 22.6 5.9 8.6 5.8 8.2 5.3 7.0 6.4 8.5 12.0 15.6 12.6 16.1 11.7 15.0 13.0 16.5 4.8 6.8 5.7 7.8 5.2 7.5 6.4 7.9 9.1 10.9 8.9 10.2 8.4 9.4 8.8 10.9 13.9 15.1 11.6 13.8 14.0 14.3 15.8 11.6 15.5 16.2 13.8 14.8 11.8 11.4 10.6 15.2 16.9 12.5 12.8 12.8 6.6 5.3 1.4 3.6 3.9 7.9 5.2 1.6 3.5 4.2 7.5 5.8 2.3 3.3 3.1 8.5 6.2 2.5 4.3 4.3 9.3 12.7 10.4 11.7 12.1 8.5 13.0 10.9 13.3 13.5 8.4 11.2 10.5 9.5 9.1 9.0 13.5 11.2 10.5 10.3 41.2 40.8 33.4 28.2 38.2 17.2 13.9 41.5 43.0 31.7 26.9 43.5 16.8 14.4 39.0 40.6 30.6 25.7 37.2 16.1 13.4 39.4 40.6 32.1 26.9 42.6 17.6 14.8 15.1 16.5 16.8 16.3 26.7 6.3 5.8 19.2 20.3 17.4 15.3 29.3 7.1 6.8 18.7 19.9 16.9 15.0 25.1 7.0 6.4 20.7 22.3 17.7 15.8 29.3 7.9 7.2 34.8 33.5 23.0 17.7 22.7 13.2 10.1 30.9 31.7 19.6 16.5 24.8 11.9 9.6 28.4 29.5 19.1 15.7 22.3 11.1 8.9 28.7 29.5 20.6 16.6 25.5 12.5 9.9 Data source: National Health and Nutrition Examination Survey (NHANES), 1999-2002, 2003-2006, 2007-2010 & 2011-2014 participants age 20 & older. Single-sample estimates of eGFR & ACR; eGFR calculated using the CKD-EPI equation. Diabetes defined as HbA1c >7 percent, self-reported (SR), or currently taking glucose-lowering medications. Hypertension defined as BP 130/ 80 for those with diabetes or CKD, otherwise BP 140/ 90, or taking medication for hypertension. Values in Figure 1.12 cannot be directly compared to those in Table 1.3 due to different survey cohorts. The table represents NHANES participants who are classified as hypertensive (measured/treated) but some of those are at target blood pressure. Abbreviations: ACR, urine albumin/creatinine ratio; BMI, body mass index; BP, blood pressure, CKD, chronic kidney disease; eGFR, estimated glomerular filtration rate. 2017 Annual Data Report Volume 1 CKD, Chapter 1 10
vol 1 Figure 1.5 Distribution of markers of CKD in NHANES participants with diabetes, hypertension, self-reported cardiovascular disease, & obesity, 2011 2014 Data Source: National Health and Nutrition Examination Survey (NHANES), 2011 2014 participants age 20 & older. Single-sample estimates of eGFR & ACR; eGFR calculated using the CKD-EPI equation. Abbreviations: ACR, urine albumin/creatinine ratio; BMI, body mass index; CKD, chronic kidney disease; SR CVD, self-reported cardiovascular disease; eGFR, estimated glomerular filtration rate; HTN, hypertension 2017 Annual Data Report Volume 1 CKD, Chapter 1 11
vol 1 Figure 1.6 Adjusted odds ratios of CKD in NHANES participants, by risk factor, 1999-2014 Data Source: National Health and Nutrition Examination Survey (NHANES), 1999 2002, 2003-2006, 2007-2010 & 2011 2014 participants age 20 & older; single-sample estimates of eGFR & ACR. Adj: age, sex, & race; eGFR calculated using the CKD-EPI equation. Whisker lines indicate 95% confidence intervals. Abbreviations: ACR, urine albumin/creatinine ratio; BMI, body mass index; CKD, chronic kidney disease; CVD, cardiovascular disease; DM, diabetes mellitus; eGFR, estimated glomerular filtration rate; HTN, hypertension; SR, self-report. 2017 Annual Data Report Volume 1 CKD, Chapter 1 12
vol 1 Figure 1.7 Adjusted odds ratios of eGFR <60 ml/min/1.73m2 in NHANES participants, by age & risk factor, 1999-2014 (a) Age category Data Source: National Health and Nutrition Examination Survey (NHANES), 1999 2002, 2003-2006, 2007-2010 & 2011 2014 participants age 20 & older; single-sample estimates of eGFR & ACR. Adj: age, sex, & race; eGFR calculated using the CKD-EPI equation. Whisker lines indicate 95% confidence intervals. Abbreviations: ACR, urine albumin/creatinine ratio; BMI, body mass index; CKD, chronic kidney disease; CVD, cardiovascular disease; DM, diabetes mellitus; eGFR, estimated glomerular filtration rate; HTN, hypertension; SR, self-report. 2017 Annual Data Report Volume 1 CKD, Chapter 1 13
vol 1 Figure 1.7 Adjusted odds ratios of eGFR <60 ml/min/1.73m2 in NHANES participants, by age & risk factor, 1999-2014 (b) CKD Risk Factor Data Source: National Health and Nutrition Examination Survey (NHANES), 1999 2002, 2003-2006, 2007-2010 & 2011 2014 participants age 20 & older; single-sample estimates of eGFR & ACR. Adj: age, sex, & race; eGFR calculated using the CKD-EPI equation. Whisker lines indicate 95% confidence intervals. Abbreviations: ACR, urine albumin/creatinine ratio; BMI, body mass index; CKD, chronic kidney disease; CVD, cardiovascular disease; DM, diabetes mellitus; eGFR, estimated glomerular filtration rate; HTN, hypertension; SR, self-report. 2017 Annual Data Report Volume 1 CKD, Chapter 1 14
vol 1 Figure 1.8 Adjusted odds ratios of urine albumin/creatinine ratio 30 mg/g in NHANES participants, by age & risk factor, 1999-2014 Data Source: National Health and Nutrition Examination Survey (NHANES), 1999 2002, 2003-2006, 2007-2010 & 2011 2014 participants age 20 & older; single-sample estimates of eGFR & ACR. Adjusted: age, sex, & race; eGFR calculated using the CKD-EPI equation. Whisker lines indicate 95% confidence intervals. Abbreviations: ACR, urine albumin/creatinine ratio; BMI, body mass index; CKD, chronic kidney disease; CVD, cardiovascular disease; DM, diabetes mellitus; eGFR, estimated glomerular filtration rate; HTN, hypertension; SR, self-report. 2017 Annual Data Report Volume 1 CKD, Chapter 1 15
vol 1 Table 1.3 Socioeconomic factors among individuals with CKD, percent of NHANES participants, 1999-2014 eGFR <60 ml/min/1.73m2 All CKD ACR 30 mg/g 1999- 2002 2003- 2006 2007- 2010 2011- 2014 1999- 2002 2003- 2006 2007- 2010 2011- 2014 1999- 2002 2003- 2006 2007- 2010 2011- 2014 Health Insurance Status Not Insured 11.4 10.1 11.4 13.8 3.9 3.3 4.2 3.9 14.7 13.2 14.8 18.9 Insured 88.6 89.9 88.6 86.2 96.1 96.7 95.8 96.1 85.3 86.8 85.2 81.1 Private Only 37.2 30.0 30.6 30.8 22.5 16.8 18.7 22.9 42.2 36.2 35.9 33.4 Medicare Only Other Government Only Private and any Government Other/Unknown Income Less than $10,000 $10,000 $24,999 17.4 4.9 17.4 5.9 15.6 5.1 15.9 6.9 23.8 2.6 23.9 2.3 20.9 3.0 23.0 5.5 16.2 5.8 14.4 7.8 13.3 6.2 12.3 8.7 21.7 26.8 28.6 22.9 36.6 41.1 44.0 34.2 14.6 19.3 21.1 17.1 7.4 9.8 8.7 9.7 10.6 12.6 9.2 10.5 6.5 9.1 8.7 9.6 14.5 29.7 7.5 28.0 6.8 23.9 8.0 24.5 13.8 31.8 6.1 31.8 4.6 26.0 5.9 25.4 16.3 29.8 8.2 27.8 8.3 24.2 9.4 25.2 $25,000 $44,999 18.8 23.2 23.4 19.8 22.6 24.7 24.3 21.2 17.2 21.0 22.6 19.3 $45,000 $74,999 15.3 20.8 18.1 18.9 13.4 19.8 19.5 19.7 14.8 21.0 16.7 17.8 $75,000 or more Missing Education < High School 11.4 10.2 14.2 6.3 20.1 7.7 22.6 6.6 8.4 10.0 10.9 6.7 16.6 9.0 22.2 5.5 11.5 10.2 15.6 6.4 20.8 7.5 21.1 7.2 33.4 26.2 27.1 22.4 37.0 27.8 26.6 21.3 32.8 26.3 29.2 23.8 High School Graduate/GED At least some College 25.6 41.0 27.1 46.7 26.9 46.0 22.3 55.3 26.1 36.9 30.6 41.4 27.5 45.9 22.2 56.5 26.3 40.9 25.0 48.6 26.3 44.5 23.5 52.7 Data Source: National Health and Nutrition Examination Survey (NHANES), 1999 2002, 2003-2006, 2007-2010 & 2011 2014 participants age 20 & older. Single- sample estimates of eGFR & ACR; eGFR calculated using the CKD-EPI equation. Abbreviations: ACR, urine albumin/creatinine ratio; CKD, chronic kidney disease; eGFR, estimated glomerular filtration rate. 2017 Annual Data Report Volume 1 CKD, Chapter 1 16
vol 1 Table 1.4 Health Risk Behaviors among individuals with CKD, percent of NHANES participants, 1999-2014 eGFR <60 ml/min/1.73m2 All CKD ACR 30 mg/g 1999- 2002 2003- 2006 2007- 2010 2011- 2014 1999- 2002 2003- 2006 2007- 2010 2011- 2014 1999- 2002 2003- 2006 2007- 2010 2011- 2014 Physical Activity 22.4 20.8 20.6 23.3 14.0 14.8 13.0 16.9 24.2 22.9 23.5 24.7 Vigorous 31.5 35.7 34.6 33.1 32.0 39.0 35.0 33.9 30.5 33.6 32.9 31.6 Moderate 46.1 43.5 44.8 43.6 53.9 46.2 52.0 49.2 45.3 43.5 43.6 43.7 Sedentary Smoking 16.6 16.2 15.0 15.0 7.4 8.7 8.4 9.1 20.4 20.1 18.7 18.6 Current 31.6 31.8 31.6 33.3 39.2 38.1 39.0 39.8 28.7 29.3 28.9 30.6 Former 51.8 52.0 53.4 51.7 53.4 53.2 52.6 51.1 50.9 50.6 52.5 50.8 Never Amount of Sleep - 15.2 15.5 13.5 - 8.9 12.6 12.4 - 18.8 17.6 14.6 Less than 6 hours - 21.9 21.5 20.5 - 21.5 19.2 18.1 - 23.7 22.8 22.3 6 hours - 55.4 53.2 54.9 - 60.8 55.4 53.0 - 51.3 51.2 54.8 7-8 hours - 7.6 9.8 11.1 - 8.8 12.8 16.5 - 6.2 8.4 8.3 9 hours or more Self-Reported Special Diet Low Fat/Low Cholesterol Low Salt/Low Sodium Sugar Free/Low Sugar Diabetic Diet Renal Diet - - - - - 3.5 2.5 2.0 6.6 - 2.8 3.5 1.1 5.2 0.3 2.4 3.6 0.4 5.1 0.6 - - - - - 3.8 3.1 2.5 6.8 - 3.3 4.7 1.5 5.4 0.7 2.8 5.3 0.3 6.9 1.2 - - - - - 2.9 2.6 1.6 7.4 - 2.5 3.6 1.1 5.2 0.5 2.1 3.1 0.5 5.5 0.8 Data Source: National Health and Nutrition Examination Survey (NHANES), 1999 2002, 2003-2006, 2007-2010 & 2011 2014 participants age 20 & older. Single-sample estimates of eGFR & ACR; eGFR calculated using the CKD-EPI equation. Abbreviations: ACR, urine albumin/creatinine ratio; CKD, chronic kidney disease; eGFR, estimated glomerular filtration rate. 2017 Annual Data Report Volume 1 CKD, Chapter 1 17
vol 1 Figure 1.9 NHANES participants physically active, 1999-2014 Data Source: National Health and Nutrition Examination Survey (NHANES), 1999-2002, 2003-2006, 2007-2010 & 2011 2014 participants aged 20 & older. Single-sample estimates of eGFR & ACR; eGFR calculated using the CKD-EPI equation. Abbreviations: ACR, urine albumin/creatinine ratio; CKD, chronic kidney disease; eGFR, estimated glomerular filtration rate. 2017 Annual Data Report Volume 1 CKD, Chapter 1 18
vol 1 Table 1.5 Awareness, treatment, & measures of control of CKD risk factors, percentage of NHANES participants, 1999-2014 eGFR <60 ml/min/1.73m2 All CKD ACR 30 mg/g 1999- 2002 2003- 2006 2007- 2010 2011- 2014 Trend p-value 1999- 2002 2003- 2006 2007- 2010 2011- 2014 Trend p-value 1999- 2002 2003- 2006 2007- 2010 2011- 2014 Trend p-value Hypertension, by current hypertensive statusa Non-hypertensive status Hypertensive (measured/treated) Control of hypertension among hypertensive patientsb Unaware Aware, not treated Aware, treated, uncontrolled Aware, treated, controlled Total cholesterolc <200 (desirable) 200 239 (borderline high) 240+ (high) Control of diabetes among patients with diabetesd Glycohemoglobin <7% (controlled) Glycohemoglobin 7% or higher (uncontrolled) 26.9 25.8 26.8 26.1 14.8 14.6 15.6 17.0 29.7 30.3 31.1 28.6 0.87 0.20 0.75 73.1 74.2 73.2 73.9 85.2 85.4 84.4 83.0 70.3 69.7 68.9 71.5 64.3 5.6 22.1 8.0 25.4 8.4 46.6 19.6 19.5 9.7 42.3 28.5 22.6 5.8 43.8 27.8 58.1 3.2 26.6 12.1 21.0 5.2 51.4 22.4 17.0 2.5 45.5 35.0 13.1 4.3 45.8 36.8 67.7 6.6 21.1 4.7 26.8 10.3 46.3 16.5 24.7 8.2 44.9 22.1 23.0 12.6 43.9 20.5 <0.001 <0.001 <0.001 44.9 34.2 20.9 52.8 27.7 19.5 58.2 27.2 14.6 61.3 24.8 13.9 43.2 35.3 21.5 53.1 27.5 19.4 59.2 26.3 14.5 61.6 24.1 14.4 40.7 37.0 22.3 56.6 25.8 17.6 62.6 23.5 13.9 64.3 22.0 13.7 <0.001 <0.001 <0.001 32.8 51.1 46.9 42.9 45.6 62.5 55.9 49.3 28.8 45.3 40.1 36.8 0.20 0.57 0.37 67.2 48.9 53.1 57.1 54.4 37.5 44.1 50.7 71.2 54.7 59.9 63.2 Data Source: National Health and Nutrition Examination Survey (NHANES), 1999 2002, 2003-2006, 2007-2010 & 2011 2014 participants age 20 & older. Single- sample estimates of eGFR & ACR; eGFR calculated using the CKD-EPI equation. Abbreviations: ACR, urine albumin/creatinine ratio; CKD, chronic kidney disease; eGFR, estimated glomerular filtration rate. a. Hypertension defined as blood pressure 130/ 80 for those with CKD and diabetes; otherwise 140/ 90, or self- reported treatment for hypertension. b. Awareness and treatment are self-reported. Control defined as <130/<80 for those with CKD and diabetes; otherwise <140/<90. c. Total cholesterol classified according to Adult Treatment Panel III blood cholesterol guidelines (ATP III). d. Glycohemoglobin classified according to American Diabetes Association guidelines. 2017 Annual Data Report Volume 1 CKD, Chapter 1 19
vol 1 Figure 1.10 NHANES participants at target blood pressure, 1999-2014 Data Source: National Health and Nutrition Examination Survey (NHANES), 1999-2002, 2003-2006, 2007-2010 & 2011 2014 participants aged 20 & older. Single-sample estimates of eGFR & ACR; eGFR calculated using the CKD-EPI equation. Figure represents all hypertensive participants including those who were at target blood pressure, probably due to medication. Abbreviations: ACR, urine albumin/creatinine ratio; CKD, chronic kidney disease; eGFR, estimated glomerular filtration rate. 2017 Annual Data Report Volume 1 CKD, Chapter 1 20
vol 1 Figure 1.11 NHANES participants within cholesterol normal range, 1999-2014 Data Source: National Health and Nutrition Examination Survey (NHANES), 1999-2002, 2003-2006, 2007-2010 & 2011 2014 participants aged 20 & older. Single-sample estimates of eGFR & ACR; eGFR calculated using the CKD-EPI equation. Abbreviations: ACR, urine albumin/creatinine ratio; CKD, chronic kidney disease; eGFR, estimated glomerular filtration rate. 2017 Annual Data Report Volume 1 CKD, Chapter 1 21
vol 1 Figure 1.12 Diabetic NHANES participants with glycosylated hemoglobin <7%, 1999-2014 Data Source: National Health and Nutrition Examination Survey (NHANES), 1999-2002, 2003-2006, 2007-2010 & 2011 2014 participants aged 20 & older. Single-sample estimates of eGFR & ACR; eGFR calculated using the CKD-EPI equation. Abbreviations: ACR, urine albumin/creatinine ratio; CKD, chronic kidney disease; eGFR, estimated glomerular filtration rate. 2017 Annual Data Report Volume 1 CKD, Chapter 1 22
vol 1 Figure 1.13 NHANES participants with CKD aware of their kidney disease, 1999-2014 (a) By stage Data Source: National Health and Nutrition Examination Survey (NHANES), 2001-2012 participants aged 20 & older. Abbreviations: CKD, chronic kidney disease. 2017 Annual Data Report Volume 1 CKD, Chapter 1 23
vol 1 Figure 1.13 NHANES participants with CKD aware of their kidney disease, 1999-2014 (b) By low eGFR and albuminuria status Data Source: National Health and Nutrition Examination Survey (NHANES), 2001-2012 participants aged 20 & older. Abbreviations: CKD, chronic kidney disease. 2017 Annual Data Report Volume 1 CKD, Chapter 1 24
vol 1 Figure 1.14 Estimated prevalence of self-reported kidney disease by state, BRFSS participants ages 18 and older (a) 2012 Data source: Behavioral Risk Factors Surveillance System (BRFSS), 2012 participants aged 18 & older. 2012 (N=471,107), 2013 (N=491,777), 2014 (N=464,617), and 2015 (N=441,460). 2017 Annual Data Report Volume 1 CKD, Chapter 1 25
vol 1 Figure 1.14 Estimated prevalence of self-reported kidney disease by state, BRFSS participants ages 18 and older (b) 2013 Data source: Behavioral Risk Factors Surveillance System (BRFSS), 2012 participants aged 18 & older. 2012 (N=471,107), 2013 (N=491,777), 2014 (N=464,617), and 2015 (N=441,460). 2017 Annual Data Report Volume 1 CKD, Chapter 1 26
vol 1 Figure 1.14 Estimated prevalence of self-reported kidney disease by state, BRFSS participants ages 18 and older (c) 2014 Data source: Behavioral Risk Factors Surveillance System (BRFSS), 2012 participants aged 18 & older. 2012 (N=471,107), 2013 (N=491,777), 2014 (N=464,617), and 2015 (N=441,460). 2017 Annual Data Report Volume 1 CKD, Chapter 1 27
vol 1 Figure 1.14 Estimated prevalence of self-reported kidney disease by state, BRFSS participants ages 18 and older (d) 2015 Data source: Behavioral Risk Factors Surveillance System (BRFSS), 2012 participants aged 18 & older. 2012 (N=471,107), 2013 (N=491,777), 2014 (N=464,617), and 2015 (N=441,460). 2017 Annual Data Report Volume 1 CKD, Chapter 1 28


")
")


 of CKD in NHANES population")