Chronic Kidney Disease Epidemiological Trends
This data report presents a comprehensive analysis of Chronic Kidney Disease (CKD) prevalence in the general population based on NHANES data from 1988 to 2012. It includes insights on the distribution of NHANES participants with diabetes, self-reported cardiovascular disease, and markers of CKD, as well as the prevalence of CKD by stage and eGFR distribution. Additionally, the prognosis of CKD based on KDIGO 2012 criteria is depicted through a detailed examination of eGFR and albuminuria categories among NHANES participants.

Download Presentation

Please find below an Image/Link to download the presentation.
The content on the website is provided AS IS for your information and personal use only. It may not be sold, licensed, or shared on other websites without obtaining consent from the author.If you encounter any issues during the download, it is possible that the publisher has removed the file from their server.
You are allowed to download the files provided on this website for personal or commercial use, subject to the condition that they are used lawfully. All files are the property of their respective owners.
The content on the website is provided AS IS for your information and personal use only. It may not be sold, licensed, or shared on other websites without obtaining consent from the author.
E N D
Presentation Transcript
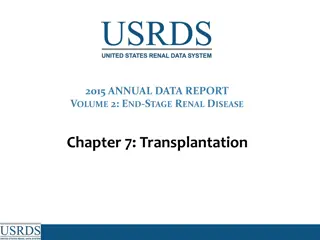
2015 ANNUAL DATA REPORT VOLUME 1: CHRONIC KIDNEY DISEASE Chapter 1: CKD in the General Population
Figure 1.1 Distribution of NHANES participants with diabetes, self-reported cardiovascular disease, & single-sample markers of CKD, 2007-2012 Data Source: National Health and Nutrition Examination Survey (NHANES), 1988 1994, 1999-2004 & 2007 2012 participants aged 20 & older. Note: Cardiovascular disease designation is based on self-report of any CVD condition (see CKD Analytical Methods chapter for detail); CKD is defined as eGFR <60 or ACR 30. Abbreviations: ACR, urine albumin/creatinine ratio; CKD, chronic kidney disease; SR CVD, self-reported cardiovascular disease; DM, diabetes mellitus; eGFR, estimated glomerular filtration rate. Vol 1, CKD, Ch 1 2
Figure 1.2 Prevalence of CKD by stage among NHANES participants, 1988-2012 Data Source: National Health and Nutrition Examination Survey (NHANES), 1988 1994, 1999-2004 & 2007 2012 participants aged 20 & older. Whisker lines indicate 95% confidence intervals. Abbreviations: CKD, chronic kidney disease. Vol 1, CKD, Ch 1 3
Figure 1.3 eGFR distribution among NHANES participants, 1988-2012 All Individuals Individuals 60+ years Data Source: National Health and Nutrition Examination Survey (NHANES), 1988 1994, 1999-2004 & 2007 2012 participants aged 20 & older. Single-sample estimates of eGFR; eGFR calculated using the CKD-EPI equation. Abbreviations: eGFR, estimated glomerular filtration rate. Accounts for change in serum creatinine assays. Vol 1, CKD, Ch 1 4
Figure 1.4 Urine albumin/creatinine ratio distribution among NHANES participants, 1988-2012 Data Source: National Health and Nutrition Examination Survey (NHANES), 1988 1994, 1999-2004 & 2007 2012 participants aged 20 & older. Single-sample estimates of ACR. Abbreviations: ACR, urine albumin/creatinine ratio. Vol 1, CKD, Ch 1 5
Table 1.1 Prognosis of CKD by KDIGO 2012 eGFR and albuminuria categories, percentage of NHANES participants, 1988-2012 NHANES 1988-1994 NHANES 1999-2004 NHANES 2007-2012 Low risk 88.0 85.9 86.2 Moderately high risk 9.0 10.5 9.8 High risk 2.1 2.3 2.3 13.0 14.1 13.8 Very high risk 0.9 1.3 1.7 Data Source: National Health and Nutrition Examination Survey (NHANES), 1988-1994, 1999-2004 & 2007-2012 participants aged 20 and older. Single-sample estimates of eGFR and ACR; eGFR calculated using the CKD-EPI equation. Abbreviations: ACR, urine albumin/creatinine ratio; CKD, chronic kidney disease; eGFR, estimated glomerular filtration rate; GFR, glomerular filtration rate; KDIGO, Kidney Disease: Improving Global Outcomes CKD Work Group. Low risk: eGFR 60 ml/min/1.73m2 and ACR < 30 mg/g; moderately high risk: eGFR 45-59 ml/min/1.73m2or eGFR 60 ml ml/min/1.73m2 and ACR 30-300 mg/g; high risk: eGFR 30-44 ml/min/1.73m2 or eGFR 45-59 ml/min/1.73m2 and ACR 30-300 mg/g or eGFR 60 ml/min/1.73m2 and ACR > 300 mg/g; very high risk: eGFR < 30 ml/min/1.73m2 or eGFR 30-44 ml/min/1.73m2 and ACR 30-300 mg/g or eGFR 60 ml/min/1.73m2 and ACR > 300 mg/g. Vol 1, CKD, Ch 1 6
Table 1.2 Prevalence (%) of CKD in NHANES population within age, sex, race/ethnicity, & risk-factor categories, 1988-2012 eGFR <60 ml/min/1.73m2 ACR 30 mg/g All CKD 1988-1994 1999-2004 2007-2012 1988-1994 1999-2004 2007-2012 1988-1994 1999-2004 2007-2012 20-39 5.1 5.9 5.7 0.1 0.3 0.2 5.0 5.8 5.5 40-59 8.4 9.8 8.9 1.3 2.0 2.3 7.5 8.4 7.2 60+ 32.2 37.5 33.2 19.1 25.1 22.7 18.0 20.1 17.7 Male 10.2 12.3 12.1 4.1 5.0 5.4 7.4 9.2 8.7 Female 14.2 15.7 15.1 5.6 7.2 7.6 10.2 10.3 9.6 Non-Hispanic White Non-Hispanic Black/Af Am Mexican American 12.3 14.0 13.9 5.5 7.0 7.6 8.2 8.9 8.4 14.5 14.9 15.9 4.1 5.0 6.2 12.7 12.4 12.3 11.8 11.2 12.0 5.0 1.5 2.2 8.2 10.5 10.8 Other Hispanic Other Non- Hispanic 14.1 13.6 11.8 3.8 3.9 4.0 12.1 11.5 9.8 11.2 15.0 11.5 2.9 4.6 3.7 9.7 12.6 9.7 Diabetes Self-reported diabetes Hypertension Self-reported hypertension Self-reported cardiovascular disease Obesity (BMI >30) All 43.1 42.0 39.2 15.6 17.0 19.6 36.3 33.3 28.6 42.7 42.2 40.4 16.4 18.5 21.1 35.9 32.6 29.3 33.3 32.7 31.0 15.3 17.1 17.1 23.4 21.3 19.8 25.3 27.2 26.0 12.9 15.8 15.2 17.1 16.4 16.2 25.4 40.0 39.5 14.5 27.3 26.8 16.6 23.0 23.8 16.6 16.8 16.6 6.2 6.4 7.3 12.3 12.6 11.5 12.0 14.0 13.6 4.9 6.2 6.5 8.8 9.8 9.2 (Continued on the next slide) Vol 1, CKD, Ch 1 7
Table 1.2 Prevalence (%) of CKD in NHANES population within age, sex, race/ethnicity, & risk-factor categories, 1988-2012 (Continued) Data Source: National Health and Nutrition Examination Survey (NHANES), 1988-1994, 1999-2004 & 2007-2012 participants aged 20 & older. Single-sample estimates of eGFR & ACR; eGFR calculated using the CKD-EPI equation. Diabetes defined as either HbA1c >7%, self- reported (SR), or currently taking glucose-lowering medications. Hypertension defined as BP 130/ 80 for those with diabetes or CKD, otherwise BP 140/ 90, or taking medication for hypertension. Values in Figure 1.12 cannot be directly compared to those in Table 1.2 due to different Survey cohorts. The table represents NHANES participants who are classified as hypertensive (measured/treated) but some of those are at target blood pressure. Abbreviations: ACR, urine albumin/creatinine ratio; BMI, body mass index; BP, blood pressure, CKD, chronic kidney disease; eGFR, estimated glomerular filtration rate; HbA1c, glycosylated hemoglobin. Vol 1, CKD, Ch 1 8
Figure 1.5 Prevalence of CKD by age & risk factor among NHANES participants, 1988-2012 Data Source: National Health and Nutrition Examination Survey (NHANES), 1988 1994, 1999-2004 & 2007 2012 participants aged 20 & older. Diabetes defined as either HbA1c >7%, self-reported, or currently taking glucose-lowering medications. Hypertension defined as BP 130/ 80 for those with diabetes or CKD, otherwise BP 140/ 90, or taking medication for hypertension. Abbreviations: BMI, body mass index; CKD, chronic kidney disease; CVD, cardiovascular disease; DM, diabetes mellitus; HbA1c, glycosylated hemoglobin; HTN, hypertension; SR, self-reported. Vol 1, CKD, Ch 1 9
Figure 1.6 NHANES participants with eGFR <60 ml/min/1.73 m2, by age & risk factor, 1988-2012 Data Source: National Health and Nutrition Examination Survey (NHANES), 1988 1994, 1999-2004 & 2007 2012 participants aged 20 & older. Single-sample estimates of eGFR; eGFR calculated using the CKD-EPI equation. Diabetes defined as either HbA1c >7%, self-reported (SR), or currently taking glucose-lowering medications. Hypertension defined as BP 130/ 80 for those with diabetes or CKD, otherwise BP 140/ 90, or taking medication for hypertension. Abbreviations: BMI, body mass index; CVD, cardiovascular disease; DM, diabetes mellitus; eGFR, estimated glomerular filtration rate; HbA1c, glycosylated hemoglobin; HTN, hypertension; SR, self-reported. Vol 1, CKD, Ch 1 10
Figure 1.7 NHANES participants with urine albumin/creatinine ratio 30 mg/g, by age & risk factor, 1988-2012 Data Source: National Health and Nutrition Examination Survey (NHANES), 1988 1994, 1999-2004 & 2007 2012 participants aged 20 & older. Single-sample estimates of ACR. Diabetes defined as either HbA1c >7%, self-reported (SR), or currently taking glucose-lowering medications. Hypertension defined as BP 130/ 80 for those with diabetes or CKD, otherwise BP 140/ 90, or taking medication for hypertension. Abbreviations: BMI, body mass index; CKD, chronic kidney disease; CVD, cardiovascular disease; DM, diabetes mellitus; HbA1c, glycosylated hemoglobin; HTN, hypertension; SR, self-report. Vol 1, CKD, Ch 1 11
Figure 1.8 Distribution of markers of CKD in NHANES participants with diabetes, hypertension, self-reported cardiovascular disease, & obesity, 2007 2012 Data Source: National Health and Nutrition Examination Survey (NHANES), 2007 2012 participants aged 20 & older. Single- sample estimates of eGFR & ACR; eGFR calculated using the CKD-EPI equation. Abbreviations: ACR, urine albumin/creatinine ratio; BMI, body mass index; CKD, chronic kidney disease; DM, diabetes mellitus; SR CVD, self-reported cardiovascular disease; eGFR, estimated glomerular filtration rate; HTN, hypertension. Vol 1, CKD, Ch 1 12
Figure 1.9 Adjusted odds ratios of CKD in NHANES participants by risk factor, 1988-2012 Data Source: National Health and Nutrition Examination Survey (NHANES), 1988 1994, 1999-2004 & 2007 2012 participants aged 20 & older. CKD defined as presence of eGFR <60 ml/min/1.73 m2, ACR 30 mg/g, and either eGFR <60 or ACR 30 for each of the comorbid conditions. Adjusted for age, sex, & race; single-sample estimates of eGFR & ACR; eGFR calculated using the CKD-EPI equation. Whisker lines indicate 95% confidence intervals. Abbreviations: ACR, urine albumin/creatinine ratio; BMI, body mass index; CKD, chronic kidney disease; CVD, cardiovascular disease; DM, diabetes mellitus; eGFR, estimated glomerular filtration rate; HTN, hypertension; SR, self-report. Vol 1, CKD, Ch 1 13
Figure 1.10 Adjusted odds ratios of eGFR <60 ml/min/1.73m2 in NHANES participants, by age & risk factor, 1988-2012 Age category CKD risk factor Data Source: National Health and Nutrition Examination Survey (NHANES), 1988 1994, 1999-2004 & 2007 2012 participants aged 20 & older; single-sample estimates of eGFR. Adjusted for age, sex, & race; eGFR calculated using the CKD-EPI equation. Whisker lines indicate 95% confidence intervals. Abbreviations: BMI, body mass index; CKD, chronic kidney disease; CVD, cardiovascular disease; DM, diabetes mellitus; eGFR, estimated glomerular filtration rate; HTN, hypertension; SR, self-report. Vol 1, CKD, Ch 1 14
Figure 1.11 Adjusted odds ratios of urine albumin/creatinine ratio 30 mg/g in NHANES participants by age & risk factor, 1988-2012 Data Source: National Health and Nutrition Examination Survey (NHANES), 1988 1994, 1999-2004 & 2007 2012 participants aged 20 & older; single-sample estimates of ACR. Adjusted for age, sex, & race. Whisker lines indicate 95% confidence intervals. Abbreviations: ACR, urine albumin/creatinine ratio; BMI, body mass index; CKD, chronic kidney disease; CVD, cardiovascular disease; DM, diabetes mellitus; HTN, hypertension; SR, self-report. Vol 1, CKD, Ch 1 15
Table 1.3 Awareness, treatment, & measures of control of CKD risk factors, percent of NHANES participants, 1988-2012 eGFR <60 ml/min/1.73m2 1999- 2004 All CKD ACR 30 1988- 1994 1999- 2004 2007- 2012 Trend p-value 1988- 1994 2007- 2012 Trend p-value 1988- 1994 1999- 2004 2007- 2012 Trend p-value Hypertension, by current hypertensive statusa Non-hypertensive status Hypertensive (measured/treated) 30.7 26.5 26.0 18.4 14.3 15.9 32.0 30.4 29.1 0.01 0.29 0.07 69.3 73.5 74.0 81.6 85.7 84.1 68.0 69.6 70.9 Control of hypertension among hypertensive patientsb Unaware Aware, not treated Aware, treated, uncontrolled Aware, treated, controlled 33.4 14.7 39.2 50.6 6.3 31.5 22.5 6.5 43.9 22.8 12.1 47.8 44.2 4.2 36.4 16.4 2.8 46.6 36.0 15.7 38.4 54.7 7.1 30.2 25.1 8.7 44.8 <0.001 <0.001 <0.001 12.7 11.5 27.2 17.3 15.2 34.2 9.9 8.0 21.4 Total cholesterolc 35.1 46.6 58.7 27.2 45.6 62.1 38.2 47.5 58.2 <200 (desirable) 200 239 (borderline high) 240+ (high) <0.001 <0.001 <0.001 33.5 32.6 26.4 32.7 33.7 23.5 32.8 31.9 27.3 31.4 20.8 14.9 40.0 20.7 13.4 29.0 20.6 14.5 Uric Acid Normal High 0.84 0.84 0.45 69.6 30.4 69.2 30.8 69.2 30.8 54.4 45.6 55.2 44.8 55.1 44.9 73.9 26.1 74.0 26.0 75.4 24.6 Smoking Current Former Never 22.2 35.2 42.6 16.9 32.3 50.7 14.6 32.6 52.8 11.9 43.2 44.9 7.8 39.4 52.8 8.2 40.1 51.6 27.0 31.5 41.5 21.3 29.1 49.6 17.6 29.7 52.6 <0.001 0.03 <0.001 Control of diabetes among patients with diabetesd Glycohemoglobin <7% (controlled) Glycohemoglobin 7% or higher (uncontrolled) 31.5 39.2 45.3 37.1 50.9 55.0 29.6 33.6 37.9 <0.001 0.003 0.04 68.5 60.8 55.7 62.9 49.1 45.0 70.4 66.4 62.1 (Continued on the next slide) Vol 1, CKD, Ch 1 16
Table 1.3 Awareness, treatment, & measures of control of CKD risk factors, percent of NHANES participants, 1988-2012 (Continued) Data Source: National Health and Nutrition Examination Survey (NHANES), 1988 1994, 1999-2004 & 2007 2012 participants aged 20 & older. Single-sample estimates of all biologic markers; eGFR calculated using the CKD-EPI equation. Abbreviations: ACR, urine albumin/creatinine ratio; CKD, chronic kidney disease; eGFR, estimated glomerular filtration rate. a. Hypertension defined as blood pressure 130/ 80 for those with CKD and diabetes, otherwise 140/ 90, or self- reported treatment for hypertension. b. Awareness and treatment are self-reported. Control defined as <130/<80 for those with CKD and diabetes; otherwise <140/<90. c. Total cholesterol classified according to Adult Treatment Panel III blood cholesterol guidelines (ATP III). d. Glycosylated hemoglobin classified according to American Diabetes Association guidelines. Trend tests for control of hypertension compares unaware to the three aware categories, total cholesterol tests < 200 vs. 200+, smoking tests any current or past smoking vs. never. Vol 1, CKD, Ch 1 17
Figure 1.12 NHANES participants at target blood pressure, 1988-2012 Data Source: National Health and Nutrition Examination Survey (NHANES), 1988 1994, 1999-2004 & 2007 2012 participants aged 20 & older. Single-sample estimates of eGFR & ACR; eGFR calculated using the CKD-EPI equation. Figure represents all hypertensive participants including those who were at target blood pressure, probably due to medication. Abbreviations: ACR, urine albumin/creatinine ratio; CKD, chronic kidney disease; eGFR, estimated glomerular filtration rate. Vol 1, CKD, Ch 1 18
Figure 1.13 NHANES participants within uric acid normal range, 1988-2012 Data Source: National Health and Nutrition Examination Survey (NHANES), 1988 1994, 1999-2004 & 2007 2012 participants aged 20 & older. Single-sample estimates of eGFR & ACR; eGFR calculated using the CKD-EPI equation. Abbreviations: ACR, urine albumin/creatinine ratio; CKD, chronic kidney disease; eGFR, estimated glomerular filtration rate. Vol 1, CKD, Ch 1 19
Figure 1.14 NHANES participants not currently smoking, 1988-2012 Data Source: National Health and Nutrition Examination Survey (NHANES), 1988 1994, 1999-2004 & 2007 2012 participants aged 20 & older. Single-sample estimates of eGFR & ACR; eGFR calculated using the CKD-EPI equation. Abbreviations: ACR, urine albumin/creatinine ratio; CKD, chronic kidney disease; eGFR, estimated glomerular filtration rate. Vol 1, CKD, Ch 1 20
Figure 1.15 Diabetic NHANES participants with glycosylated hemoglobin <7%, 1988-2012 Data Source: National Health and Nutrition Examination Survey (NHANES), 1988 1994, 1999-2004 & 2007 2012 participants aged 20 & older. Single-sample estimates of eGFR & ACR; eGFR calculated using the CKD-EPI equation. Abbreviations: ACR, urine albumin/creatinine ratio; CKD, chronic kidney disease; eGFR, estimated glomerular filtration rate. Vol 1, CKD, Ch 1 21
Figure 1.16 NHANES participants with CKD aware of their kidney disease, 2001-2012 Data Source: National Health and Nutrition Examination Survey (NHANES), 2001-2012 participants aged 20 & older. Abbreviations: CKD, chronic kidney disease. Vol 1, CKD, Ch 1 22
Figure 1.17 Estimated prevalence of self-reported kidney disease by state, BRFSS participants, 2012 (N = 464,494) Data Source: Behavioral Risk Factors Surveillance System (BRFSS), 2012 participants aged 20 & older. Vol 1, CKD, Ch 1 23


 of CKD in NHANES population within")
 of CKD in NHANES population within")