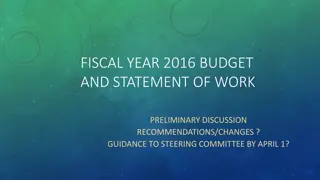
City of Pittsburgh 2015 Budget and Five-Year Plan Overview
The City of Pittsburgh faced significant deficits in 2015-2018 due to revenue shortfalls and poor budgeting practices. This overview outlines key cost drivers, proposed solutions, and the importance of balanced budgeting. Key components include pension, health care, debt service, and public safety considerations.
Download Presentation

Please find below an Image/Link to download the presentation.
The content on the website is provided AS IS for your information and personal use only. It may not be sold, licensed, or shared on other websites without obtaining consent from the author. If you encounter any issues during the download, it is possible that the publisher has removed the file from their server.
You are allowed to download the files provided on this website for personal or commercial use, subject to the condition that they are used lawfully. All files are the property of their respective owners.
The content on the website is provided AS IS for your information and personal use only. It may not be sold, licensed, or shared on other websites without obtaining consent from the author.
E N D
Presentation Transcript
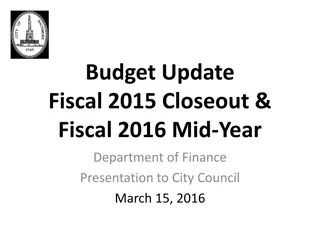
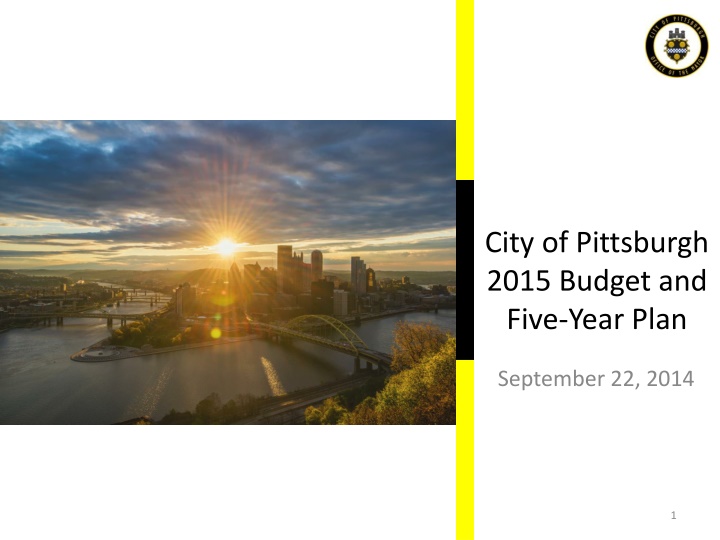
City of Pittsburgh 2015 Budget and Five-Year Plan September 22, 2014 1
Our preliminary forecast indicated that the City would face significant deficits through 2018 and a shrinking fund balance each year The City is required to have a balanced budget and present a five-year projection that achieves the primary objectives of the Amended Recovery Plan. 2
The projected deficits were the product of increased expenditures, revenue shortfalls, and poor budgeting practices of the past $21M increase in expenditures from 2014 $7.3M reduction in real estate tax revenues $2.2M in operating costs previously funded in the capital budget $4.4M less in projected revenues from other sources The Act 47 Plan included increased legacy costs and increased real estate tax revenue, but did not include the $7.2M increase for public safety or the $4.4M gap in other revenues. 3
Our proposed solution to declining revenues and increased costs will start with truth in budgeting and provide a solid plan for the City s finances Expenditures: $23.2M additional Pension: The December 2013 action to lower the assumption on investment returns without identifying a corresponding revenue created an $8M gap that combined with changes in mortality rates will increase costs by $11.4M. Health benefits: $2.7M increase based on current plans. Debt Service: $2M increase based on current structure. Public Safety premium pay: $5M increase based on truth in budgeting. PS equipment/other expenses in the capital budget: $2.2M Revenue: $11.7M revenue gap Real Estate: $7.3M less due to millage reduction in 2013 Revenue gaps compared to Act 47 Plan projections: URA PILOT: $1.5M EMS Revenue: $1.3M Public Service Privilege: $600K Fines & Forfeitures: $500k Non-Profit PILOT: $400k Key Components of the Solution Parking Revenue: $10M increase over the Parking Authority s 2013 contributions to the City. Elimination of 75 vacant positions: $3.4M Debt Refinancing: $3.7M savings due to current low rates Reduction in non-personnel expenditures: $1.6M Maximum Compensation Allocations and Other Act 47 Initiatives: $8.2M Real Estate: Revenue-neutral millage adjustment of 0.5 mills to generate ~$8M in accordance with the Act 47 Plan. 4
Pension, health care, debt service, and public safety are the main cost drivers for the 2015 Budget, a $23.2M increase over the 2014 Budget $2 million increase $11.4 million increase $2.7 million increase $5 million increase $2.2 million increase *OMB identified $2.2M in public safety equipment previously funded in the capital budget that must be funded in the operating budget to comply with City Code and the Act 47 Plan. 5 * As stated in the Act 47 Plan, the City s actuary estimates that reducing the assumed investment rate of return from 8.0 percent to 7.5 percent costs ~$8M per year.
Public Safety premium pay historically has been under-budgeted, requiring significant year-end transfers to cover actual costs The budgeted amounts for Police premium pay remained stagnant since 2009; EMS since 2008. Total Public Safety Premium Pay $30.0 End of year transfers covered shortfalls each year. $28.5 Key cost drivers include the following: Police: Over $3M for court time, FLSA, and worked holidays. Fire: Over $9M related to callbacks for minimum staffing; worked holidays and FLSA are also factors. EMS: Staffing to meet operational needs, worked holidays. $24.9 $23.7 $22.7 $21.4 $21.4 $20.2 Budget overages were covered through a combination of strategies: Holding approvals for adding new classes of Public Safety personnel to generate savings in the salaries accounts; and Maintaining high vacancy rates in other City departments, which impacted the delivery of core municipal services. 2011 2012 2013 2014 Actual Amount (Millions) Budgeted Amount (Millions) The 2015 Budget for Public Safety includes realistic projections for premium pay based on staffing and operational needs and increased oversight to monitor controllable costs. 6
The real estate tax is the Citys largest revenue source, but the 2013 millage adjustment created a $35M hole in the five-year plan In 2013 the City reduced the millage rate 30%, from 10.8 mills to 7.56 mills. While these efforts were intended to keep the current year real estate tax revenues at the prior year s level, actual real estate tax revenues declined from $126.6M in 2012 to $119.3M in 2013. The result is a $35M hole in the City s five-year plan. A revenue-neutral millage adjustment of 0.50 mills would allow the City to regain the revenue lost from reducing the rate in 2013 and avoid drastic reductions in core municipal services that would be required to fill the gap: Reducing the number of Police Officers by 75; or Closing 5 Fire Stations; or Eliminating City Planning, Building Inspection, and Animal Control; or Eliminating 20% of the Department of Public Works The Act 47 Plan requires the City to restore real estate revenue lost in 2013 to generate $128M in 2015 without relying on one-time responses that do not provide sustainable revenue. 7
In addition to the decline in real estate tax revenue, the City faces an additional shortfall of $4.4M in revenue compared to the Act 47 Plan The City s projections were reviewed with the Act 47 Coordinators, the ICA, the City Council Budget Office, and the City Controller as part of our consensus revenue forecasting process. 8
The 2015 Budget and Five-Year Plan will strengthen the Citys finances, modernize city government, and prevent cutbacks in essential services $10M savings by refinancing of debt and reducing operating expenses Elimination of 75 Vacant Positions Full Maximize Opportunities to Generate Non-Tax Revenue Implementation of the 2010 Council- Controller Plan Increase Capital Spending on Existing Infrastructure Revenue-Neutral Millage Adjustment Truth in Budgeting and Transparent Financial Practices A Solid Plan for the City s Long-Term Financial Health Maintain Minimum Fund Balance of 10% With the 2015 Budget and Five-Year Plan, we will focus on bringing honesty, transparency, and leading practices to budgeting and financial management methods. 9
The 2015 Budget includes strategic initiatives to improve the delivery of essential services and enhance the quality of life in our neighborhoods Funding for 892 Police Officers, 657 Firefighters, and 175 Paramedics. Creation of new positions to improve data analysis and support the vision and plans of our new Police Chief. Public Safety Increased funding for City Planning to strengthen its core functions and deliver better customer service in an environment of increasing zoning applications, increasing strategic and neighborhood planning, and growing demand for data-driven decision-making. Community Development and Planning Transformation of the Bureau of Building Inspection through organizational redesign, process automation and improvement, expanded use of technology, and enhanced customer service. Building Inspection and Code Enforcement Expanded use of technology to deliver Public Works services more efficiently and effectively. Leverage grant funding to spur government modernization and develop data-driven management tools for leadership. Service Delivery Innovation and Transformation 10
The Mayors proposed Five-Year Plan achieves the primary objectives of the Act 47 Plan and strengthens the City s long-term financial position City of Pittsburgh Operating Budget Fiscal Year 2015 Five-Year Financial Forecast 2014 Estimate 2015 Budget 2016 Forecast 2017 Forecast 2018 Forecast 2019 Forecast REVENUES Real Estate Tax Other Revenues Amusement Tax Earned Income Tax Deed Transfer Tax Parking Tax Facility Usage Fee Payroll Preparation Tax Local Service Tax Act 77 - Tax Relief License and Permit Charges for Services Fines and Forfeits Intergovernmental Non-Profit Payment for Services Beginning Fund Balance 124,645,607 $ 1,431,211 14,551,366 85,441,895 19,936,735 50,762,910 4,046,610 56,433,374 14,067,211 12,619,515 9,286,458 28,008,650 8,623,160 46,936,936 2,302,723 7,100,000 133,805,579 $ 1,299,278 14,843,157 87,142,707 18,099,199 53,324,821 4,111,907 58,155,361 14,129,832 20,128,750 11,270,084 30,307,075 8,880,687 54,859,003 400,000 1,902,000 134,810,911 $ 1,296,598 15,065,760 88,883,883 18,370,687 55,018,442 4,194,082 59,893,103 14,200,481 20,531,325 11,320,184 29,527,541 9,013,897 54,290,661 402,000 475,000 135,823,904 1,315,159 15,291,701 90,659,874 18,646,247 56,456,404 4,277,900 61,682,944 14,341,990 20,941,952 11,620,535 29,957,756 9,149,106 57,915,566 404,010 136,844,624 $ 1,344,672 15,521,032 92,471,377 18,925,941 58,427,814 4,363,394 63,526,444 14,484,911 21,360,791 11,921,138 30,397,149 9,286,342 58,636,374 406,030 137,873,113 $ 1,374,930 15,753,802 94,319,101 19,209,830 60,239,076 4,450,598 65,425,215 14,629,259 21,788,007 12,221,993 30,846,769 9,425,637 50,449,958 408,060 - - - Total Revenues 486,194,360 $ 512,659,440 $ 517,294,555 $ 528,485,048 $ 537,918,033 $ 538,415,348 $ EXPENDITURES Operating Departments Pension & OPEB Health Benefits Workers Comp Debt Service Total Expenditures 257,372,289 $ 54,841,955 61,484,139 19,228,343 87,286,746 480,213,472 $ 264,993,188 $ 66,771,353 63,971,542 20,877,457 89,300,304 505,913,844 $ 264,506,820 $ 68,975,700 69,089,265 21,283,006 88,604,080 512,458,871 $ 269,347,004 $ 72,639,121 74,616,406 21,696,666 87,646,846 525,946,044 $ 274,069,136 $ 88,330,895 80,116,406 22,118,600 72,161,484 536,796,521 $ 279,340,572 $ 89,027,890 85,616,406 22,518,600 42,835,900 519,339,368 $ OPERATING RESULT $ 5,980,888 $ 6,745,596 $ 4,835,684 $ 2,539,004 $ 1,121,512 19,075,980 $ BEGINNING RESERVE FUND BALANCE Transfer to Paygo Reserve Fund Balance Transfer 82,030,086 $ (25,000,000) (7,104,170) 55,906,804 $ (5,000,000) (1,902,000) 55,750,400 $ (5,000,000) (475,000) 55,111,084 $ 57,650,088 $ 58,771,600 $ (25,000,000) - - - - - ENDING RESERVE FUND BALANCE 55,906,804 $ 55,750,400 $ 55,111,084 $ 57,650,088 $ 58,771,600 $ 52,847,580 $ FUND BALANCE AS A % OF EXPENDITURES 11.6% 11.0% 10.8% 11.0% 10.9% 10.2% 11

