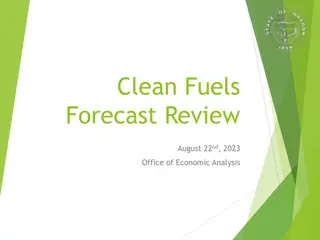
Clean Fuels Forecast Review - August 22nd, 2022 Teams Online
This forecast review covers major policy changes, reported volumes forecast, ODOT fuel forecast, and more for the clean fuels industry. Explore insights into upcoming trends and developments in the sector.

Download Presentation

Please find below an Image/Link to download the presentation.
The content on the website is provided AS IS for your information and personal use only. It may not be sold, licensed, or shared on other websites without obtaining consent from the author. If you encounter any issues during the download, it is possible that the publisher has removed the file from their server.
You are allowed to download the files provided on this website for personal or commercial use, subject to the condition that they are used lawfully. All files are the property of their respective owners.
The content on the website is provided AS IS for your information and personal use only. It may not be sold, licensed, or shared on other websites without obtaining consent from the author.
E N D
Presentation Transcript
Clean Fuels Forecast Review Final Version August 22nd, 2022 Teams Online
2023 Forecast Review AGENDA Committee Business Major Policy Changes/Proposals ODOT Fuel Forecast Reported Volumes Forecast Carbon Intensities for Biofuels Credit/Deficit Forecast Supply Forecast Next Steps Adjourn
Major Policy Changes/Proposals Inflation Reduction Act Washington Clean Fuels Program Portland Diesel Regulation
ODOT Forecast 40.0% Gasoline Diesel 30.0% 20.0% Percent Change Y/Y 10.0% 0.0% -10.0% -20.0% -30.0%
Reported Volumes Forecast Motor Gasoline Ethanol Diesel Biodiesel Renewable Diesel On-Road Electricity Off-Road Electricity Natural Gas Liquified Petroleum Gas
Motor Gasoline (Y/Y change) EIA Pacific Outlook ODOT Gasoline Forecast Clean Fuels Program 2020 -10.5% -12.8% -19.1% 2019 0.0% -1.2% 1.6% 2021 3.7% 8.5% 6.3% 2022F 3.1% -3.4% -3.3% 2023F 1.9% -0.7% -0.8% Motor Gasoline 500 450 400 Millions of Gallons 350 300 250 200
Ethanol (Y/Y change) EIA National Outlook ODOT Gasoline Forecast Clean Fuels Program 2020 -12.3% -12.8% -18.5% 2019 -0.6% -1.2% 0.8% 2021 8.2% 8.5% 9.7% 2022F 3.1% -3.4% -5.1% 2023F 3.3% -0.7% -0.8% Blend Rate 10.0% 10.1% 10.4% 10.2% 10.2% Ethanol 55 50 Millions of Gallone 45 40 35 30
Total Diesel (Y/Y change) EIA Pacific Outlook ODOT Diesel Forecast Clean Fuels Program 2020 -13.0% 6.6% -6.1% 2019 4.7% -0.8% 3.5% 2021 4.1% 6.5% 8.1% 2022F -3.4% -3.8% -3.9% 2023F 4.6% -0.8% -0.8% Total Diesel 220 200 180 Millions of Gallons 160 140 120 100
Biodiesel (Y/Y change) EIA National Outlook ODOT Diesel Forecast Clean Fuels Program 2020 -20.7% 6.6% 13.9% 2019 -3.1% -0.8% 16.3% 2021 -5.6% 6.5% 10.3% 2022F 12.4% -3.8% 3.0% 2023F -31.3% -0.8% 9.1% Blend Rate 7.5% 9.2% 9.3% 10.0% 11.0% Biodiesel/Renewable Diesel Blend Rate Biodiesel 16.0% 24 14.0% 22 12.0% 20 10.0% 18 Millions of Gallons 8.0% 16 6.0% 14 4.0% 12 2.0% 10 0.0% 8 -2.0%
Renewable Diesel (Y/Y change) EIA National Outlook ODOT Diesel Forecast Clean Fuels Program 2020 13.1% 6.6% 6.8% 2019 -9.8% -0.8% 1251.0% 2021 2022F 36.8% -3.8% 59.5% 2023F 5.8% -0.8% 73.6% 111.0% 6.5% -44.0% Blend Rate 2.0% 2.3% 1.2% 2.0% 3.5% Biodiesel/Renewable Diesel Blend Rate Renewable Diesel 16.0% 12 14.0% 10 12.0% 8 10.0% Millions of Gallons 6 8.0% 6.0% 4 4.0% 2 2.0% 0 0.0% -2 -2.0%
Total Electric Vehicles 250,000 200,000 150,000 100,000 50,000 0
On-road Electricity (Y/Y change) EIA Pacific Outlook ODOT Electric Vehicle Clean Fuels Program 2020 -6.5% 21.4% 27.6% 2019 7.2% 34.2% 28.7% 2021 35.7% 25.6% 27.3% 2022F 20.9% 35.0% 43.6% 2023F 16.0% 30.7% 36.5% Total On-Road Electricity KWh per Vehicle 3.0 5,500 5,000 2.5 4,500 Millions of Gallons 2.0 4,000 1.5 3,500 1.0 3,000 0.5 2,500 0.0 2,000
Off-road Electricity (Y/Y change) EIA Pacific Outlook Clean Fuels Program 2020 -6.5% 45.7% 2019 7.2% 28.5% 2021 35.7% 54.1% 2022F 20.9% 50.0% 2023F 16.0% 50.0% Total Off-Road Electricity 3.5 3.0 2.5 Millions of Gallons 2.0 1.5 1.0 0.5 0.0
Natural Gas (Y/Y change) EIA Pacific Outlook Clean Fuels Program 2020 -20.2% -0.7% 2019 19.0% 7.2% 2021 71.1% 7.7% 2022F -19.0% 10.0% 2023F 30.4% 12.0% Biogas Blend Rate 67.1% 88.7% 90.8% 92.5% 95.0% Natural Gas Biogas Blend Rate 1.2 100.0% 90.0% 1.0 80.0% 70.0% 0.8 Millions of Gallons 60.0% 0.6 50.0% 40.0% 0.4 30.0% 20.0% 0.2 10.0% 0.0 0.0%
Liq. Petroleum Gas (Y/Y change) EIA Pacific Outlook Clean Fuels Program 2020 -47.3% -28.2% 2019 -2.0% 177.6% 2021 17.3% 65.7% 2022F 16.5% 47.8% 2023F 8.0% 44.6% Liquified Petroleum Gas 1.6 1.4 1.2 1.0 Millions of Gallons 0.8 0.6 0.4 0.2 0.0
Table 1: Clean Fuels Forecast - Reported Volumes annual %ch vs. 2021 2019 2020 2021 2022F 1,299.3 147.6 10.20% 1,446.9 2023F 1,289.5 146.5 10.20% 1,436.0 (Mil. gallons, percent) Conventional Gasoline Ethanol Ethanol Blend Rate Blendstock 1,565.4 174.0 10.0% 1,739.4 1,265.4 141.8 10.07% 1,407.2 1,340.7 155.6 10.40% 1,496.3 -1.9% -3.0% -2.0% Fossil Diesel Biodiesel Biodiesel Blend Rate Renewable Diesel Renew diesel Blend Rate Total Diesel 719.8 60.1 7.5% 16.3 2.0% 796.1 661.8 68.4 9.2% 17.4 2.3% 747.6 723.3 75.5 9.3% 9.7 1.2% 808.6 684.0 77.7 10.0% 15.5 2.0% 777.3 659.4 84.8 11.0% 27.0 3.5% 771.2 -4.5% 6.0% 66.4% -2.3% Electricity (on-road) Electricity (off-road) 2.9 2.2 3.7 3.2 4.7 5.0 6.7 7.5 9.2 11.2 40.0% 50.0% Fossil Natural Gas Biogas Biogas Blend Rate Total Natural Gas 1.1 2.2 0.4 2.9 0.3 3.2 0.3 3.6 0.2 4.1 -18.3% 13.6% 67.1% 88.7% 90.8% 92.5% 95.0% 3.3 3.3 3.5 3.9 4.4 11.0% Liquified Petroleum Gas 2.1 1.5 2.4 3.6 5.2 46.2% On-road electricity include calculation of residential charging.
Carbon Intensities for Biofuels Ethanol Biodiesel Renewable Diesel
Ethanol Carbon Intensity 80.0 75.0 70.0 65.0 60.0 55.0 50.0 45.0 Oregon California 40.0 Forecast assumption Lower bound 35.0 30.0 2021 = 53.7; 2022 = 52.0; 2023 = 50.0
Biodiesel Carbon Intensity 60.0 50.0 40.0 30.0 20.0 Oregon Lower bound 10.0 California Forecast assumption 0.0 2021 = 41.8; 2022 = 40.0; 2023 = 39.0
Renewable Diesel Carbon Intensity 65.0 55.0 45.0 35.0 25.0 Oregon California 15.0 Prelim assumption Lower bound 5.0 2021 = 37.0; 2022 = 36.0; 2023 = 34.0
Energy Density Carbon Intensity Target Carbon Intensity Assumption Gasoline Ethanol Diesel Biodiesel Renewable Diesel Electricity KWh/vehicle EERelect EER_NG Natural Gas Biogas Liq. Petroleum Gas 122.48 81.51 134.48 126.13 129.65 3.60 4242 3.40 0.90 134.48 134.48 89.63 91.68 91.68 92.32 92.32 92.32 91.68 100.14 50.00 100.74 39.00 34.00 0.00 92.32 92.32 91.68 79.98 0.00 35.00
Credit / Deficit Summary 2022F -1,112,416 -637,480 -1,749,896 2023F -1,336,206 -746,671 -2,082,877 Deficits Gasoline Diesel Deficit Total Credits Ethanol Biodiesel Renewable Diesel Electricity, on-road Electricity, off-road Natural Gas Liquified Petroleum Gas 495,028 527,563 116,519 260,177 172,961 35,284 18,357 1,625,888 497,623 570,551 204,104 349,569 259,441 46,419 26,553 1,954,260 Credit Total Net Credits/Deficits Beginning Banked Credits Total Net Credits/Deficits -124,009 771,000 646,991 -128,617 646,991 518,374
Bio-Fuel Supply EPA National Production Ethanol Biodiesel Renewable Diesel Compressed Natural Gas
EPA Renewable Fuel Standard Program - Reported Production 2017 2018 2019 2020 2021 2022 Est. 14,970.0 106.2 15,076.2 6.1% 1,593.7 269.6 1,863.3 -2.6% 1,627.3 463.8 2,091.1 58.8% 529.3 Ethanol Domestic Importer 14,883.1 90.5 14,973.7 1.2% 1,588.2 461.9 2,050.2 -11.1% 258.3 344.4 602.7 2.0% 157.5 14,985.8 92.0 15,077.8 0.7% 1,855.5 175.1 2,030.6 -1.0% 305.5 309.8 615.3 2.1% 214.4 14,746.4 213.4 14,959.7 -0.8% 1,713.8 184.7 1,898.5 -6.5% 492.1 420.4 912.5 48.3% 317.0 11.1 51.8 24.4 404.4 32.4% 12,870.7 197.2 13,067.9 -12.6% 1,824.9 209.5 2,034.4 7.2% 533.5 435.5 969.0 6.2% 388.1 24.3 80.9 10.6 503.9 24.6% 14,136.8 72.9 14,209.8 8.7% 1,704.4 208.5 1,912.8 -6.0% 845.4 471.0 1,316.4 35.9% 451.6 33.0 81.0 Total Ethanol Y/Y change Biodiesel Domestic Importer Total Biodiesel Y/Y change Renewable Diesel Domestic Foreign Generation Total Renewable Diesel Y/Y change Renewable CNG Total Importer Domestic Importer 1.6 52.7 30.8 242.6 28.7% 8.3 55.2 27.5 305.4 25.9% 31.4 89.8 4.9 655.4 15.2% Renewable LNG 3.1 Total Natural Gas Y/Y change Propane Y/Y change 568.7 12.9% Domestic 0.0 0.7 4.2 4.3 4.6 6.1 537.7% 2.3% 5.9% 34.6% Note: 2022 estimates based on year-over-year growth through first six months. https://www.epa.gov/fuels-registration-reporting-and-compliance-help/rins-generated-transactions
Ethanol Supply Available to Oregon (Existing Suppliers in 2022) Nameplate Capacity (Mil. Gallons) Number of Facilities State South Dakota Nebraska Iowa Minnesota North Dakota Colorado Oregon Total Oregon Suppliers 858 565 521 140 82 70 40 12 7 4 2 1 2 1 29 2,276 Data from Clean Fuels Program. 2023 Projected Volume = 146.5 million gallons, 6.4 percent
Biodiesel Supply Available to Oregon (Existing Suppliers in 2022) Nameplate Capacity (Mil. Gallons) Number of Facilities Locality Iowa Minnesota Arkansas Illinois Canada North Dakota Washington Missouri Oregon Texas Mississippi South Korea Michigan Total Oregon Suppliers 260 130 124 120 101 95 84 42 17 13 12 4 1 2 2 3 1 1 1 1 1 1 1 1 5 1 1,003 20 Data from Clean Fuels Program. 2023 Projected Volume = 84.8 million gallons, 8.5 percent
Renewable Diesel Supply Available to Oregon (Existing Suppliers in 2022) Nameplate Number of Facilities Capacity (Mil. Gallons) Locality North Dakota California Singapore Wyoming Louisiana Washington Cananda Total Oregon Suppliers 184 180 116 70 35 35 20 639 1 1 1 1 1 1 1 7 Data from the Clean Fuels Program 2023 Projected Volume = 27.0 million gallons, 4.2 percent
Renewable Natural Gas Supply Available to Oregon (Existing Suppliers in 2022) Nameplate Number of Facilities Capacity (Mil. Gallons) Locality Pennsylvania Canada New York Texas Kentucky Louisiana Wisconsin Total Oregon Suppliers 34.4 14.0 12.3 10.0 9.5 4.3 0.0 84.5 2 1 1 1 1 1 1 8.0 Data from the Clean Fuels Program 2023 Projected Volume = 4.4 million gallons, 5.2 percent
Next Steps Distribute draft forecast document by August 31st. Comments due back by 5:00 September 12th. If necessary, follow-up meeting scheduled for September 15th, 1:30 3:00.
Questions or comments: Contact Michael Kennedy Michael.kennedy@das.Oregon.gov (971) 678-5595 Or Mark McMullen Mark.mcmullen@das.Oregon.gov (971) 345-1003


")
")
")
")
")

")
")
")
")