Client Data Insights and Performance Measures in HIV/AIDS Service Report
Explore the 2019 Ryan White Services Report and Client Summary Data, showcasing trends in HIV/AIDS status, gender, age, and ethnicity. Understand how data informs decision-making for allocating resources and supporting health outcomes.

Download Presentation

Please find below an Image/Link to download the presentation.
The content on the website is provided AS IS for your information and personal use only. It may not be sold, licensed, or shared on other websites without obtaining consent from the author. If you encounter any issues during the download, it is possible that the publisher has removed the file from their server.
You are allowed to download the files provided on this website for personal or commercial use, subject to the condition that they are used lawfully. All files are the property of their respective owners.
The content on the website is provided AS IS for your information and personal use only. It may not be sold, licensed, or shared on other websites without obtaining consent from the author.
E N D
Presentation Transcript
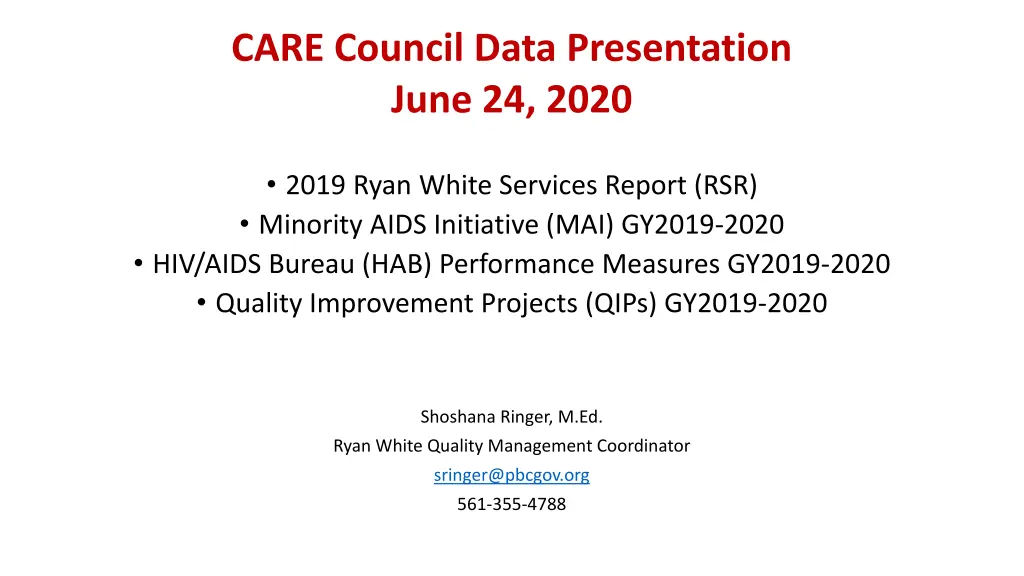
CARE Council Data Presentation June 24, 2020 2019 Ryan White Services Report (RSR) Minority AIDS Initiative (MAI) GY2019-2020 HIV/AIDS Bureau (HAB) Performance Measures GY2019-2020 Quality Improvement Projects (QIPs) GY2019-2020 Shoshana Ringer, M.Ed. Ryan White Quality Management Coordinator sringer@pbcgov.org 561-355-4788
Ryan White HIV/AIDS Program Service Report (RSR) Ryan White HIV/AIDS Program Service Report (RSR) The RSR is an annual Client summary report required by our funders Health Resources & Services Administration (HRSA). Funded Subrecipients, who provide services under the Part A program, are required to document and submit data on the clients they serve. Data is reported on a calendar year (January-December), not a grant year (March-February). These data sets are utilized by our program; To understand the types of clients we served, To make informed decisions on prioritizing needed services and allocating funds to services provided, To explain how we are using our funds and supporting health outcomes of our clients, in our annual grant application.
2019 RSR Client Summary Report Data 2019 RSR Client Summary Report Data Number of Clients by HIV Status Reported a decrease of 270 clients Number of Clients by HIV/AIDS Status Reported a decrease of 263 diagnosed with AIDS CDC-defined AIDS (<200 CD4 Count) Total # of Unduplicated Clts 3573 2671 2408 # of Clients # of Clients 3302 892 583 20182 2019 CDC-defined AIDS HIV Positive 2018 2019
2019 RSR Client Summary Report Data cont. Number of Clients by Gender and HIV Status Largest group remains Males Number of Clients by Enrollment Status Only Active and Deceased categories were reported on the RSR Client report from PE in 2019. Enrollment Status Gender Breakdown 2165 Removed due to violation of rules 2029 70 20182 2019 Relocated 36 1381 # of Clients 1259 2019 Referred to another program or discharged 301 2018 14 Deceased 21 17 14 3284 Active Female Male Transgender 3132
2019 RSR Client Summary Report Data cont. Number of Clients by Age and HIV Status Largest group remains 45-64 years old 2-12 years old decreased by 3 Number of Clients by Race, Ethnicity and HIV Status Largest group remains Black/African American Age Breakdown 2018 2019 2018 2019 34 36 1983 1855 644 613 650 596 # of Clients 1054 946 2249 2064 412 404 Hispanic Hispanic 110 Black or African American Black or African American 96 4 1 White White 2-12 years 13-24 years 24-44 years 45-64 years 65+ years Other Other
2019 RSR Client Summary Report Data cont. Number of Clients by Household Income and HIV Status Largest group remains Below 100% of the Federal Poverty Level (FPL) Number of clients below 100% FPL decreased by 241 Number of Clients by RSR Housing/Living Arrangement and HIV Status Largest group remains Stable/permanent Temporary, Unstable, Unknown Increased by 24 Household Income HRSA Defined Housing Breakdown 2000 1800 3278 2993 1600 1400 1200 # of Clients 1000 # of Clients 800 600 400 200 0 309 285 Below 100% FPL 100-138% FPL 139-200% FPL 201-250% FPL 251-400% FPL 401-500% FPL More than 500% FPL 2018 1791 501 549 314 384 17 5 2019 1550 476 542 299 421 8 6 Stable/permanent Temporary, Unstable, Unknown 2018 2019 2018 2019
2019 RSR Client Summary Report Data cont. Number of Clients and Service Visits by Service Category The 3 top services utilized remains NMCM/Eligibility, OAMC, and MCM. The 3 lowest utilized services are HCBHS, Housing, and Medical Nutritional Therapy. Number of Clients by Medical Insurance and HIV Status Largest group remains No insurance/uninsured There was an increase in Private- Individual coverage by 80 Health Insurance Service Category Early Intervention Services Home & Community Based Health Services Medical Case Management Medical Nutritional Therapy Mental Health Oral Health Outpatient Ambulatory Medical Care (including Specialty Medical Care and Lab services) # of Clients 430 3 # of Visits 1538 10 2111 2091 16 94 725 633 41,869 16 847 2460 2578 1533 # of Clients 1161 1023 867 790 708 628 Local Pharmacy Assistance Program Non-Medical Case Management Emergency Financial Assistance (including EFA-Prior Authorization) Food Bank (including Nutritional Supplements) Health Insurance Program Housing Medical Transportation Other Professional Services (Legal) 165 2919 73 718 8886 84 370 353 37 30 6 5 571 5468 371 11 356 150 2179 69 1573 2402
2019 RSR Clinical Summary Report Data * The Clinical Summary reports on clients who have had a clinical service. Therefore, the numbers from the RSR Client Summary Report and the RSR Clinical Summary Report are different. Number of Clients by Risk Factor Heterosexual contact remains the most common risk factor reported Hemophilia/coagulation disorder and Injection Drug Use were not included in 2019 PE report. There was a reporting issue in PE, still awaiting GTI correction, for 539 as unknown. Number of New Clinical Clients Decreased by 131. Total # of New Clinical Clients Risk Factors 295 1684 # of Clients # of Clients 164 539 512 68 50 50 49 44 43 3 2 1 2018 2019
2019 RSR Clinical Summary Report Data cont. Number of Clients by Number of Medical Care Visits The most number of clients had 3-4 visits reported but the number of those clients decreased dramatically. Number of New Clients Having Viral Load Test During Reporting Period Decreased by 115. New Clients having VL Tests Medical Care Visits in 2018 274 1040 925 # of Clients 159 # of Clients 167 147 2018 2019 1 Visit 2 Visits 3-4 Visits 5 or More Visits
2019 RSR Total Clients Served by Zip Code Summary (New to RSR Report) The report resulted in a total of 3,314 clients served, within 62 zip codes in Palm Beach County. Zip codes are determined by the client profile address information entered into the database. Charted are the 5 zip codes with the highest number of clients served. There were 23 zip codes in Palm Beach County that resulted in 10 or less clients served. Zip Code Clients Served 33407 308 33404 256 33435 207 33444 198 33460 191
Minority AIDS Initiative (MAI) Minority AIDS Initiative (MAI) MAI formula grants provide core medical and related support services to improve access and reduce disparities in health outcomes in metropolitan areas hardest hit by HIV/AIDS. In GY19, our local MAI program only supported intensive targeted Medical Case Management (MCM) services, which were prioritized for African Americans (including Haitians) and Hispanic/Latino(a) clients that had elevated viral loads. Clients in these 2 populations, who have complex health issues, were enrolled in MAI services. MCM staff work closely with a team of the clients medical providers, to determine the best approach to assist the client in becoming healthier and maintaining better health.
MAI Data MAI Unduplicated Clients MAI Unduplicated Clients Served GY 19 Served GY 19- -20 MAI MAI HIV Viral Load Suppression HIV Viral Load Suppression Rate GY18 & GY19 Comparison Rate GY18 & GY19 Comparison 20 88% All MAI Clients 84% 91% Haitian 88% 291 Black/African American Hispanic/Latino 93% Hispanic/Latino 588 87% Haitian 120 87% Black/African American 83% 2019 2018 * Haitian clients will count in more than one category on these reports.
MAI Data Comparison GY19 MAI vs. Part A MCM Viral Suppression Rate GY19 MAI vs. Part A MCM Viral Suppression Rate GY19 MAI vs. Part A MCM Annual Retention Rate GY19 MAI vs. Part A MCM Annual Retention Rate 88% 97% Total MCM Total MCM 89% 91% 91% Haitian Haitian 93% 93% 97% Hispanic/Latino Hispanic/Latino 93% 96% 87% 97% Black/African American Black/African American 87% 95% MAI Part A MAI Part A
HIV/AIDS Bureau (HAB) Health Outcome Measures HIV/AIDS Bureau (HAB) Health Outcome Measures Recipients should analyze performance measure data to assess quality of care and health disparities and use the performance measure data to inform quality improvement activities. (HRSA PCN #15-02) In our program, the 2 performance measures we focus on for client health outcomes are the HAB measures of Viral Load Suppression and Annual Retention in Care As we collect and analyze these measures, low performance is identified and studied to determine how we can improve the low performance measures. This occurs through the quality improvement (QI) activities.
HAB Performance Measures HAB Performance Measures Definitions Definitions Viral Suppression: Denominator: Number of patients with a diagnosis of HIV with at least one medical visit in the measurement year. Numerator: Number of patients in the denominator with a HIV viral load less than 200 copies/ml at last HIV viral load test during the measurement year. Annual Retention in Care: Denominator: Number of patients with a diagnosis of HIV who had at least one HIV medical encounter within the 12-month measurement year. Numerator: Number of patients in the denominator who had at least two HIV medical care encounters at least 90 days apart within a 12-month measurement year. At least one of the two HIV medical care encounters needs to be a medical visit with a provider with prescribing privileges. An HIV medical care encounter is a medical visit with a provider with prescribing privileges or an HIV viral load test
Service Category Viral Load Suppression % N/D Annual Retention in Care % N/D 86% 627/731 95% 696/731 AOMC 87% 775/888 96% 849/888 Labs 85% 185/186 92% 171/186 APA (LPAP) GY 19-20 89% 371/419 92% 386/419 Specialty Medical Care 92% 837/906 95% 857/906 (3/1/2019 through 2/28/2020) Oral Health 92% 211/229 99% 227/229 Medical Nutritional Therapy 84% 137/164 95% 156/164 Mental Health 91% 418/457 93% 423/457 Health Insurance Assistance 73% 408/562 81% 457/562 EIS 86% 6/7 100% 7/7 Home & Community Based Health Care 89% 1788/2020 91% 1846/2020 MCM 88% 457/518 88% 458/518 NMCM 88% 2503/2857 89% 2539/2857 Eligibility 91% 32/35 97% 34/35 EFA-PA 84% 58/69 78% 54/69 EFA 85% 17/20 100% 20/20 Food- Nutritional Supplements 90% 606/676 96% 652/676 Food Bank 84% 466/558 95% 530/558 Medical Transportation 71% 20/28 82% 23/28 Emergency Housing 84% 201/238 96% 228/238 Legal Services 87% 2598/2971 89% 2640/2971 All Services All Funded Agencies
Quality Improvement Projects (QIP) Quality Improvement Projects (QIP) Quality improvement involves the development and implementation of activities to make changes to the program in response to the performance data results. To do this, Recipients and Sub-recipients are required to implement quality improvement activities aimed at improving patient care, health outcomes, and patient satisfaction. Once QIPs are created and tested, we are then able to understand if specific changes or improvements had a positive impact on patient health outcomes or if further changes in RWHAP funded services are necessary. 2019 Project: Improving HIV Health Outcomes with Data (Case Managed, Non-Suppressed)
Quality Improvement Project Quality Improvement Project Improving HIV Health Outcomes for Ryan White Non-Virally Suppressed Clients
Quality Improvement Initiative: Improving HIV Quality Improvement Initiative: Improving HIV health outcomes health outcomes of Non of Non- -VS clients VS clients Project Objective Develop a quality improvement collaborative to increase the number of People Living with HIV (PLWH) who have suppressed HIV Viral load from 82% to 90% within the measurement period (2019 calendar year). Setting Medical Case Management Sub-recipients receiving Ryan White (RW) Part A funding in Palm Beach County Performance Measure: HIV Viral load Suppression Percentage of patients, regardless of age, with a diagnosis of HIV with a HIV viral load less than 200 copies/ml at last HIV viral load test during the measurement year.
Quality Improvement Initiative: Improving HIV Quality Improvement Initiative: Improving HIV health outcomes of Non health outcomes of Non- -VS VS clients cont clients cont. . Data Abstraction Time Frame: Baseline data: Jan 1st -December 31st, 2018 Follow-up data: Jan 1st- March 31st, 2019 April 1st -June 30th July1st-September 30th October 1st -December 31st, 2019 Data Exclusions: Clients were excluded from the QIP cohort if they were deceased, had relocated, did not have a viral load test result, or were inactive during the measurement period.
Quality Improvement Initiative: Improving HIV Quality Improvement Initiative: Improving HIV health outcomes of Non health outcomes of Non- -VS clients cont. VS clients cont. Baseline Data HIV Viral Suppression rates during Calendar year 2018 (January December) Baseline data as of December 2018: 162 Non- Virally Suppressed Case Managed(CM) clients 82% Viral Suppression Rate Total Number of CM clients Non-Virally Suppressed 162 Black African American 126 White 33 Asian 3 American Indian 0 Native Hawaiian 0 Haitian 35 Hispanic/Latino 18 Male 96 Female 65 Transgender 1
QIP Cohort Demographics Characteristics QIP Cohort Demographics Characteristics Demographic Number (n=117) % (60%) Excluded (n=162) Demographic Number (n=117) % (60%) Gender Age Group Male 71 61% 25 13-17 1 1% Female 46 39% 19 18-24 6 5% Transgender 0 0% 1 25-34 21 18% Race 35-44 14 12% Black/African American 91 78% 35 45-54 36 31% White 25 21% 8 55-64 29 25% Asian 1 1% 2 65> 10 8% Ethnicity Housing Type Non-Hispanic 103 88% - Stable/Perman ent 103 88% Hispanic 14 12% 4 Haitian Born Temporary 7 6% Yes 29 25% 6 Unstable 7 6% No 88 75% -
Quality Improvement Initiative: Improving HIV Quality Improvement Initiative: Improving HIV health outcomes of Non health outcomes of Non- -VS clients cont. VS clients cont. Testing QI Interventions QI teams identified their ideas of change and tested them using a PDSA rapid cycle improvement measurement on small scale. The following interventions were tested: (a) Improving adherence to medications by setting-up phone alarm reminders (b) Removing behavioral health barriers by offering behavioral health assessment and referral to mental health therapists (c) Decreasing behavioral health barriers to achieve HIV viral load suppression by selecting and administering an evidence based tool to screen clients for symptoms of Post-Traumatic Stress Syndrome (PTSD) (d) Improving adherence to treatment by assessing barriers and readiness to change health behaviors. The intervention model was based on the Transtheoretical or Stages of Change Model (e) Improving medication adherence by promoting change of negative health behaviors and participation of non-virally suppressed clients in Interdisciplinary Care Team (ICT) meetings.
Quality Improvement Initiative: Improving HIV Quality Improvement Initiative: Improving HIV health outcomes of Non health outcomes of Non- -VS clients cont. VS clients cont. Results By the end of the measurement period (12/31/2019), there were 117 of the initial 162 clients remained in the QIP cohort. Forty five (45) clients were excluded due to inactive status and one for not having a viral load test result in 2019. Sixty percent (60%) of clients achieved HIV Viral Load suppression. 2018 Baseline (12/31/2018) Not Virally Suppressed As of 12/31/2019 Numerator 162 70 Denominator 162 117 Percentage not suppressed 100% 40% Percentage Suppressed 0% 60%
Quality Improvement Initiative: Improving HIV Quality Improvement Initiative: Improving HIV health outcomes of Non health outcomes of Non- -VS clients cont. VS clients cont. Results cont. The final QIP cohort was comprised of 117 clients. The average age was 48. The majority (77.8%) of clients were Black/African American, 88% were Non-Hispanic Latino(a), 24.8% Haitian born. Most (88%) clients lived in stable housing, 6% had a temporary living arrangement, and 6% lived in unstable housing. MCM subrecipients concluded their QIP cycles by adopting the following changes: (a) setting phone cell alarm reminders to improve adherence to medications, (b) screening and referral of clients with undiagnosed, untreated behavioral health issues, (c) involving clients in interdisciplinary care team (ICT) meetings and care planning to improve knowledge of disease and promoting changes in health behaviors, and (d) using the Transtheoretical or stages of change model to improve adherence to treatment and health outcomes. All MCM subrecipients agreed to continue using client level data to monitor health outcomes.
Quality Improvement Initiative: Improving HIV Quality Improvement Initiative: Improving HIV health outcomes of Non health outcomes of Non- -VS clients cont. Results cont. HIV viral load outcomes: By the end of the measurement period (December 31, 2019), more than half (60%) of clients in the QIP cohort achieved viral load suppression. Of those clients in the cohort, 45.3% had an undetectable viral load (<50 copies m/L), 14.5% were virally suppressed (<199 copies m/L) and 40% did not achieve viral suppression (200-101,000 copies m/L). Disparities in achieving the desired health outcome were observed among Black or African American males and to a lesser extent for those aged 45-64. The overall viral suppression achieved by all clients receiving MCM services was 91%. This was over the 90% project objective set at the beginning of the initiative. VS clients cont.

")


")


 Health Outcome Measures")


")