Climate Change Economics by Jon Haveman, Ph.D.
Economic building blocks of climate change and how economists can help fight it. Understand the impacts, reducing emissions, and policy implications. See real examples of externalities and the need for regulation.

Download Presentation

Please find below an Image/Link to download the presentation.
The content on the website is provided AS IS for your information and personal use only. It may not be sold, licensed, or shared on other websites without obtaining consent from the author.If you encounter any issues during the download, it is possible that the publisher has removed the file from their server.
You are allowed to download the files provided on this website for personal or commercial use, subject to the condition that they are used lawfully. All files are the property of their respective owners.
The content on the website is provided AS IS for your information and personal use only. It may not be sold, licensed, or shared on other websites without obtaining consent from the author.
E N D
Presentation Transcript
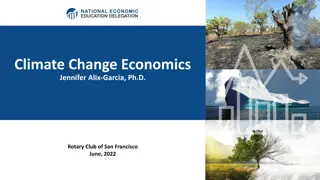
Climate Change Economics Jon Haveman, Ph.D. NEED Vistage - Corte Madera March 16, 2022
Credits and Disclaimer This slide deck was authored by: - Sarah Jacobson, Williams College - Shana McDermott, Trinity University - Sharon Shewmake, Western Washington University This slide deck was reviewed by: - Jason Shogren, University of Wyoming - Walter Thurman, North Carolina State University Disclaimer - NEED presentations are designed to be nonpartisan. - It is, however, inevitable that the presenter will be asked for and will provide their own views. - Such views are those of the presenter and not necessarily those of the National Economic Education Delegation (NEED). 2
Outline Economic Building Blocks Climate Change Impacts of Climate Change Reducing Emissions Climate Change Policy Policy in Action
How Can Economists Help Fight Climate Change? By assessing behavioral reactions to climate change. By measuring climate change damages and estimating the costs of fighting climate change. By designing smart policies that minimize costs to society. 5
Econ 101: When Everything Is Simple, No Regulation Is Needed for Efficiency Simple transactions: buyer and seller feel all costs and benefits of sales They choose based on the costs & benefits they feel Efficient number of transactions! (Maximizes social benefits) 6
When Our Decisions Affect Others, We Need Regulation Pollution causes an EXTERNALITY: a side effect (here, a cost) that affects someone else - Polluting things have an unfair cost advantage because part of cost is offloaded on others - Too much pollution is generated - Regulation limiting pollution has net benefits The efficient amount of pollution balances costs & benefits of pollution
Examples of Externalities Negative Externalities: Positive Externalities - Heating your house - Education - Smoking - Growing apples - Getting a dog - Getting a vaccination - Pig farming - Basic scientific research 8
How Economists Decide How Much to Fight Climate Change: Cost Benefit Analysis Abating greenhouse gas emissions is costly but without action, climate change damages are even more costly. Expected costs of reducing emissions Expected damages from allowing climate change Goal is not zero emissions, but efficient level that achieves a balance.
Cost-Benefit Analysis of Fighting Climate Change Most economic models suggest the costs of keeping warming below 2 C are relatively small, amounting to 1-4% of GDP by 2030. Costs of acting to keep warming below 2 C are almost certainly less than future economic damages they would avoid. - Damages estimated to be between: 7-20% of worldwide GDP.
The Atmospheric Greenhouse Effect Sun Atmosphere Energy reflected back onto earth Energy reflected back into space
Atmospheric CO2 Concentrations Up To Now Source: NOAA
What Do Greenhouse Gas Emissions Do? Increase temperatures - Sea level rise - Storm surges Alter precipitation patterns More variable weather More / more powerful storms Carbon dissolves in ocean 14
How Damages Will Vary Globally: Mortality as an Example 15
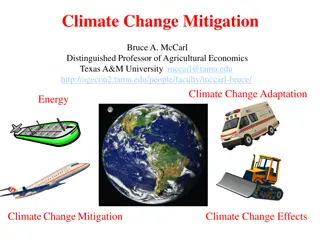
A Climate Change Ladder Emissions Mitigation (a.k.a. Abatement) Adaptation Damages 17
How These Impacts Affect Humans Reduced fresh water availability Wildfires Shifting zones for important ecosystems, and desertification Reduced worker productivity Increased violence Some of these may cause human migration and/or conflict Agriculture Fisheries Coastal damages Direct health effects, including sickness and death (temperature & drought; also pollution) Indirect health effects (vector- borne disease)
Social Cost of Carbon The expected cost of damages from each unit of greenhouse gas emissions. Current EPA estimate: ~$51 per metric ton of CO2 (but estimates vary a lot!) - About $157/car per year. - $32 Billion for all vehicles in the US. Social cost of carbon will increase over time.
Adaptation Reduces Damages Adaptation: costly action that reduce damages from climate change. The net damage cost to society is the cost of adaptation plus the cost of remaining damages. People and firms will take some actions on their own, up to the point where they find it worthwhile. Some adaptation requires government involvement.
Individual-Level Adaptation Perhaps you - Stay inside more. - Turn on the air conditioning. Farmers may: - Plant at different times. - Plant new crops. Businesses may: - Give outdoor workers water / shade breaks. - Move to a more hospitable climate. Everyone might: - Think about moving to a safer place.
Public Adaptation Governments can help: - When collective action is less costly than everyone acting alone. - When individual action is not possible or likely. - When some people can t protect themselves. Sea walls Ecosystems that provide protection Policies that protect workers or low-income and vulnerable populations Planned retreat (moving a community)
Global Net Emissions Are What We Care About For climate impacts, we don t care where they are emitted, only how much. - There may be other local impacts. Gross emissions (greenhouse gas sources): how much greenhouse gases (including CO2) we put out. Greenhouse gas sinks: ways to pull CO2 out of the air. - Existing: oceans, forests - Increase sinkage by planting trees, or other measures
Total U.S. Greenhouse Gas Emissions by Economic Sector in 2020
Which Emissions Should We Cut? List all possible ways to reduce emissions. Figure out how much each can reduce in total. Figure out how much each costs per unit of emissions reduced. Line them up in order: cheapest to costliest ( marginal abatement cost curve ) - Tackle first the cheapest ones!
Example Abatement Cost Curve (Don t trust these numbers, this is just to show the idea)
But Are Costs So Easy to Assess? Difficult to project future costs for new technology. - Costs of renewables have been dropping fast. Investments in research and development and infrastructure (e.g., EV charging) can lower future costs. Barrier to expanding renewable energy: intermittency. - Battery technology under development.
Geoengineering and Carbon Capture Technical pathways to reduce climate change without reducing emissions. Carbon capture: captures CO2 emissions and stores them or utilizes them (for energy, pressure, etc.). - Not yet proven at scale Solar geoengineering: make the atmosphere reflect more light to regain earlier thermal balance. - Totally theoretical - Potentially risky
Policies That Reduce Emissions Directly Command and control regulation - Emissions standards or limits (e.g., Clean Water Act discharge limits) - Tech standards (e.g., require scrubbers on power plants) Incentive-based policies - Putting a price on emissions leveling the playing field! o Tax or cap & trade o Subsidizing green energy (e.g., feed-in tariffs) 36
How Does a Carbon Tax Work? Choose activities to be covered - E.g., extraction, electricity sector, all emitters, etc.). Set tax level. - Optimally, it represents the social cost of polluting. Polluters must pay a tax for every unit emitted. - Polluters with low abatement costs will abate to avoid the tax. - Polluters with high abatement costs will pollute and pay the tax. 37
How Does Cap and Trade Work? Choose activities to be covered (e.g., electricity sector, all emitters, etc.). Set maximum emissions level ( cap ). That many pollution permits are issued. - Can be auctioned off or given to polluters Every polluter in a covered sector must have a permit for every unit of pollution. Polluters buy and sell ( trade ) permits on a market as they wish. - Polluters with low abatement costs will make / save money by abating and selling / not buying permits - Polluters with high abatement costs will buy permits and pollute 38
Both Policies are Work Through Prices 39 Full video: https://www.youtube.com/watch?v=XHK1OBSBpwc
Thoughts on Regulation vs Market-Oriented Equity. - Both types of policies might be regressive. o Cap and Trade and a Carbon Tax can offset the regressivity. o Regulations do not. Efficiency. - Market-oriented policies tend to achieve emissions reduction at much lower cost. o Example: CAF Standards vs Carbon Tax Tax is significantly more efficient. Why? 40
Efficiency: CAF vs Carbon Tax CAF = Corporate Average Fuel Efficiency - A fuel economy standard mandating that an auto maker s vehicle fleet must meet minimum fuel economy standards. Horse Race - Tax on fuel applies to ALL vehicles, not just new. - Rebound Effect: o Driving a more efficient vehicle lowers the cost per mile driven leading to more miles driven. - Slower turnover of inefficient vehicles: higher cost of new. Summary - A given level of emission reductions costs 3-14 times more with CAF standards than under a comparable carbon tax. 41
Examples of Other Policies that Reduce Emissions Research and development subsidies Renewable energy mandates (e.g., renewable portfolio standards) Energy efficiency mandates and subsidies (e.g. CAFE fuel economy standards) Grid / infrastructure improvements Public transportation Land use / zoning policies
Atlanta and Barcelona Have Similar Populations but Very Different Carbon Productivity Atlanta Barcelona Source: New Climate Economy Report, 2014
Incentive-Based Climate Policies Right Now Source: World Bank Carbon - Pricing Dashboard
Californias Cap and Trade System Since 2012 0.7% of global greenhouse gas emissions
Californias AB32: Global Warming Solutions California s goals: - Reduce emissions to 1990 levels by 2020 - An 80% reduction in emissions from 1990 levels by 2030 California s Tools: - Cap and Trade - Renewable Portfolio Standard - Clean Cars Program - Low Carbon Fuel Standard
Change in California GDP, Population, and GHG Emissions since 2000 Cap & Trade ->
Summary Climate change is real, is caused by human actions, and has impacts we re already feeling. This problem won t solve itself; we need policy intervention, and fast. Smart policy can reduce greenhouse gas emissions by the right amount and at the lowest possible cost. - For example, cap and trade and emissions taxes! We also need policies to help with adaptation and support those bearing the greatest damages.