Climate Change Indicators
The relationships between key climate change indicators, causation, correlation, and data collection methods. Learn about variables, direct and inverse relationships, and how scientists track and analyze climate data to confirm climate change. Discover essential vocabulary related to climate science and watch a NASA video explaining Earth System Science.

Download Presentation

Please find below an Image/Link to download the presentation.
The content on the website is provided AS IS for your information and personal use only. It may not be sold, licensed, or shared on other websites without obtaining consent from the author.If you encounter any issues during the download, it is possible that the publisher has removed the file from their server.
You are allowed to download the files provided on this website for personal or commercial use, subject to the condition that they are used lawfully. All files are the property of their respective owners.
The content on the website is provided AS IS for your information and personal use only. It may not be sold, licensed, or shared on other websites without obtaining consent from the author.
E N D
Presentation Transcript
Observing Signs of Climate Change 2022 Climate Superstars Task #2
Learning Objectives After completing this task, you will be able to Explain how years of observational data confirm climate change. Identify and describe the types of key climate change indicators scientists track. Explain the difference between direct and inverse relationships using key climate change indicators.
Vocabulary Causation indicates that one event is the result of the occurrence of the other event (i.e. there is a causal relationship between the two events); this is also referred to as cause and effect Correlation a mutual relationship or connection Data facts and statistics collected for reference or analysis Direct relationship when two variables change in the same direction, effect, position, or order Indicator a measurable variable that characterizes an environment or situation Inverse relationship when two variables change in opposite or reverse direction, effect, position, or order Variable a factor, condition, or event that can be changed or controlled in order to study or test a hypothesis
Watch this video that explains how NASA studies earth as a complex dynamic system. Video with cartoon characters and "Earth System Science" on a whiteboard Description automatically generated https://youtu.be/f9F7yDjSdNA
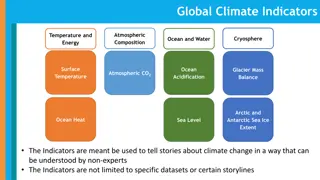
Collecting Climate Data What exactly are scientists measuring with their observations? They are documenting atmospheric, terrestrial, and marine conditions or variables looking for connections or relationships. Turns out many of the variables are key indicators of climate change. If two variables correlate, a change in one is accompanied by a similar or opposite change in the other. If two indicators move in the same direction, they have a direct relationship. When two indicators move in opposite directions, they have an inverse relationship. Take a look at the following infographic that depicts ten indicators that correlate with global warming.
Relationships Between Indicators - Inverse Let's take a look at the relationship between two climate change indicators: sea ice cover and sea level. On this infographic, there is a black down arrow next to sea ice, letting us know that as the world warms, sea ice decreases. Where does all that melting ice go? As the world warms and sea ice decreases, the sea level increases (or rises). We can see this on the infographic indicated by the white upward facing arrow next to the term sea level.
Relationships Between Indicators - Inverse As sea ice decreases, the sea level increases. When two variables change in opposite direction, that relationship is called an inverse relationship. Sea ice and sea level have an inverse relationship.
Relationships Between Indicators - Direct Now, let's take a look at the relationship between snow cover and sea ice. On this infographic, there is a black down arrow next to sea ice, letting us know that as the world warms, sea ice decreases. As the world warms, snow cover also decreases. We can see this on the infographic indicated by the black downward facing arrow next to the term snow cover.
Relationships Between Indicators - Direct As sea ice decreases, snow cover decreases too. When two variables change in the same direction, that relationship is called a direct relationship. Keep in mind that these two variables, sea ice and snow cover are correlated one variable is not necessarily causing the other to change. In fact, scientists know that the warming earth is what is causing both sea ice and snow cover to melt.
Using evidence from the Ten Indicators of a Warming World infographic, complete the following questions: Identify two indicators, other than sea ice and sea level, that have an inverse relationship. Identify two indicators, other than sea ice and snow cover, that have a direct relationship. Action Item