Climate Statistics, SDGs, Fossil Fuel Transactions Agenda
Climate statistics research agenda focusing on Sustainable Development Goals (SDGs) and fossil fuel transactions. Includes indicators per SDG, Agenda 2030 goals, and the System of Environmental-Economic Accounting (SEEA) for unified economic and physical data.

Download Presentation

Please find below an Image/Link to download the presentation.
The content on the website is provided AS IS for your information and personal use only. It may not be sold, licensed, or shared on other websites without obtaining consent from the author.If you encounter any issues during the download, it is possible that the publisher has removed the file from their server.
You are allowed to download the files provided on this website for personal or commercial use, subject to the condition that they are used lawfully. All files are the property of their respective owners.
The content on the website is provided AS IS for your information and personal use only. It may not be sold, licensed, or shared on other websites without obtaining consent from the author.
E N D
Presentation Transcript
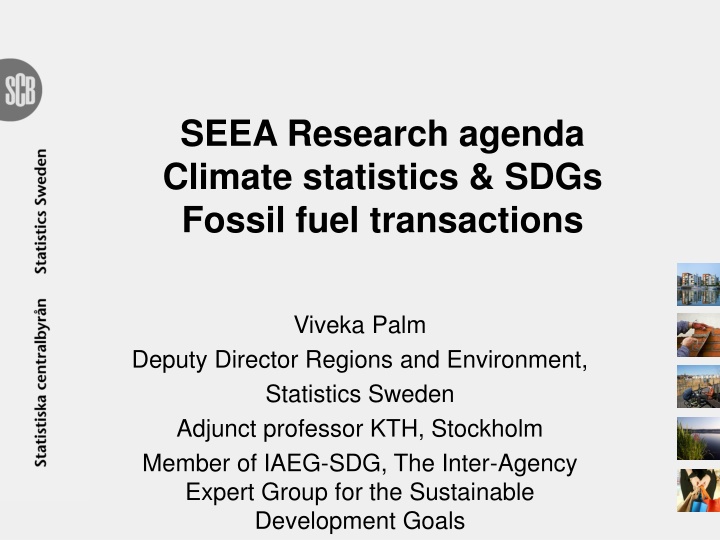
SEEA Research agenda Climate statistics & SDGs Fossil fuel transactions Viveka Palm Deputy Director Regions and Environment, Statistics Sweden Adjunct professor KTH, Stockholm Member of IAEG-SDG, The Inter-Agency Expert Group for the Sustainable Development Goals
The 17 SDG goals and SEEA 1. Poverty 2. Agriculture, food security 3. Health 4. Education 5. Gender 6. Water 7. Energy 8. Growth and employment 9. Infrastructure and innovation 10. Inequality 11. Cities 12. Sustainable production and consumption 13. Climate change 14. Marine areas 15. Land degradation and biodiversity loss 16. Peace, justice 17. Governance including statistical capacity Basic human needs Economy Environment Society
Indicators per sust dev goal 30 25 4 8 20 8 9 2 2 15 1 2 5 5 7 1 5 3 1 9 10 4 5 3 5 1 3 11 15 6 13 8 5 6 6 2 2 10 5 7 5 5 8 6 6 4 4 4 1 2 2 2 2 2 2 1 1 0 Tier 1 Tier 2 Tier 3
Agenda 2030 Goal 12 Indicator 12.c.1: Amount of fossil fuel subsidies per unit of GDP and as a proportion of total national expenditure on fossil fuels International subsidy data available from collections of IEA, OECD, World Bank, IMF An expert group is formed to suggest a method for the indicator. UN Environment is the Custodian for the indicator. The group has had two meetings so far. Some NSO:s are part of the group.
The SEEA: one unified account with economic and physical data MILJ STA TISTIK Luftutsl pp 1. Jordbruk 2. Skogsbruk 3. Fiske 4. Gruv or, mineralbrott 5. Liv smedel, textil m m 6. Massa, papper, grafisk 7. Kemisk industri 8. Petroleumraffinaderier 9. J rn-, st l- o metallv erk 10. Verkstadsindustri 11. El-, gas- o v rmev erk 12. Vatten- o av loppsv erk 13. Byggnadsindustri 14. Samf rdsel 15. Handel o v r. tj nster 16. Bost der o fastigheter 17. Hush llens id ella org. 18. Offentliga myndigheter 1171 26 731 87 203 5366 234 119 1877 177 #### 2######## 707 676 Milj tillst nd 1. Jordbruk 2. Skogsbruk 3. Fiske 4. Gruv orott 5. Liv smedel, textil m m 6. Massa, p 7. Kemisk 7. Kemisk 9. J rn-, st l- o metallv erk 10. Verkstads 11. El-, gas- o v rmev erk 12. Vatten- o a 1171 26 731#### 87 203 5366 234 119 92 1877 1352 456 #### 103 49 676 5 8 5 Varor och tj nster Produktionsaktiviteter (branscher) Privat konsumtion Anv ndning o f rdeln av inkomster Kapitalbildning Utlandet Total 17 707 1467 17 602 17 698 752 602 962####2467 30 NATIONAL- R KENSKAPER ####4726#### 8#### 7838356 1087154 3652868 Icke- finan- siella f retag 92 9 Lager- f r nd- ringar 231 342 Investe- ringar Transak- tioner 456 1085 7562868 579 6365 50525884098 63 590 207 183 936 614 101115 27 950 25 599 222#### 579 170 242 1 2 3 4 18 1 2 3 4 5 Hus-h ll Environm. Environm. statistics statistics 1933 1197 120 19331182 1197 120 2615002 211#### 1421627 548 National National Accounts Accounts Varor och tj nster 1. Jordbruk 2. Skogsbruk 3. Fiske 4. Gruvor, mineralbrott 5. Livsmedel, textil m m 6. Massa, papper, grafisk 17. Hush llens id ella org. 18. Offentliga myndigheter 1. Jordbruk 2. Skogsbruk 3. Fiske 4. Gruvor, mineralbrott 5. Livsmedel, textil m m 6. Massa, papper, grafisk 19. Of rdelade Icke varuankn skatter/subv Egentliga l ner Kollektiva avgifter Drift verskott netto 1171 26 87 203 5366 119 #### 2 #### 21905 330 699 52 395 147 543 510 541 800 1026 871 -991 709 374 448 5152 41598 50162 51978 24203 2337 32962 352565 136599 20986 406071 29204 19178 960 9151 176779 116047 5925 -35255 630158 237362 233403 796370 177001 731 590 207 170 274 100 96 707 575 328 319 278 -4 1664 328 271 1933 890 63 14. Samf rdsel 15. Handel o v r 16. Bost der o 17. Hush llens 18. Offentliga 271 1933 890 63 60 377 27 17 68 5 698 1467 298 #### 69 3713 27 -302 -4620 -289 #### 234 92 203575 17515 20986 3291 222 297 99 258 147 Vattenutsl pp 1. Jordbruk 2. Skogsbruk 3. Fiske 4. Gruv orott 5. Liv smedel, textil m m 6. Massa, p 7. Kemisk 7. Kemisk 9. J rn-, st l- o metallv erk 1171 26 731 87 203 5366 234 119 1877 177 1352 456 180 168 #### 2######## 707 676 Vattenutsl pp 1. Jordbruk 2. Skogsbruk 3. Fiske 4. Gruv or, mineralbrott 5. Liv smedel, textil m m 6. Massa, papper, grafisk 7. Kemisk industri 8. Petroleumraffinaderier 9. J rn-, st l- o metallv erk 10. Verkstadsindustri 11. El-, gas- o v rmev erk 12. Vatten- o av loppsv erk 13. Byggnadsindustri 14. Samf rdsel 15. Handel o v r. tj nster 16. Bost der o fastigheter 17. Hush llens id ella org. 18. Offentliga myndigheter 19. Of rdelade 13. Byggnadsin 14. Samf rdsel 15. Handel o v r. tj 16. Bost Icke v aruan Egentliga l ner Kollektiv a Drift v ersk CO2 SO2 NOx NMVOC NH3 1171 26 731 87 203 5366 234 119 103 49 676 Produktions- aktiviteter (branscher) #### 271 5 8 5 #### 1260 2521 2645 1,23 3453 17 707 17 602 17 698 68 298 5 10 397 752 602 4726#### #### 4669 756 962 1382 960 5 98 41 30 9 487 783 2311190 108 342 575 365 8 8663 82 318 18 2318 353 92 69 92 177 4561085 756 579 170 314 61 554 21 417 546 4 10 579 170 242 995 15 523 147 25 54 3010 53 251 -327 15 523 147 25 3 6541 127 5646 2615002 211 142 Produktions- faktorer 15 152 152 874 #### 70 2 5 349 11. El-, gas- o v rmev erk 12. Vatten- o a 13. Byggnadsindustri 14. Samf rdsel 15. Handel o v r 16. Bost der o 17. Hush llens 18. Offentliga 19. Of rdelade 13. Byggnadsindustri 14. Samf rdsel 15. Handel o v r. tj nster 16. Bost der o fastigheter Icke v a Egentliga l ner Kolle Drift v erskott netto CO2 SO2 NOx NMVOC NH3 1197 120 505 63 120 4098 5486725 96 #### 152 152 874 40 49 25 3132 2947 68 1199 1142 241 3776 9375 541 89 1748 #### 34 666 9687 300 -119 #### 590 207 170 274 100 328 936 614 473 113 441 63 1933 890#### 599 222 297 1664 271 1933 890 614#### 5250#### 271 601186 657 377 27 99 758 27 950####9756#### 25 599 222#### 3415#### Privat kons. delning av inkomster Kapitalbildning Utlandet 796370 574 Offentlig sektor Hush ll 815 6403 1371 163 1167 8742 5884 278 1536 547 6875 35 796370 Av fall #### 31322947 1199 37769375 300 -119#### #### 70 70 2 5 349 Av fall #### 70 349 379 8 L pande transakt. (import) Kapitaltransaktioner 8670 1453 395 #### 421494 891748 361 4705 126 326 45 Total #### #### 2337 #### #### #### #### 960 9151 #### 796370 205715 -13742 473292 Kemikalier 2 5 349 -3492322 370 #### 666 7857####9882 Kemikalier 70 349 379 8 22 370 6035 361 37769375 300 -119####9108 #### 424 157 441############ 1 0 19 14 7 5 55 0 #### 326 Utsl pp Utsl pp 424 18 16 30 1 3 2 1 0 12 16 36 0 18 16 30 4 4 6 4 9 9 7 1 0 1 3 2 19 7 55 14 5 0 12 0 0 1 1 Varor och tj nster Produktionsaktiviteter (branscher) Produktionsfaktorer Privat konsumtion Icke varu- ankn skatter/ subv 21905 800 KapitalbildningUtlandet Total Lag er- f r nd- ring tioner 871 330 1026 ### 699 255 -4 27 205 ### 203575 3291 ### 12425 255 ### 39023 ### CO2 SO2 Nox VOC MILJ - Inve ste- ringa r R KENSKAPER Transak- 1 Environmental Environmental Accounts Accounts 2 3 4 5 5.1 18 1 2 3 4 5 5.1 18 676 Varor och tj nster 1. Jordbruk 2. Skogsbruk 3. Fiske 4. Gruvor, mineralbrott 5. Livsmedel, textil m m 5.1 Milj v nlig livsmprod 8. Petroleumraffinaderier 18. Offentliga myndigheter 1. Jordbruk 2. Skogsbruk 3. Fiske 4. Gruvor, mineralbrott 5. Livsmedel, textil m m 5.1 Milj v nlig livsmprod 8. Petroleumraffinaderier 19. Of rdelade Icke varuankn skatter/subv Egentliga l ner Drift verskott netto 1171 26 731 87 203 5366 234 45 1352 456 180 168 1085 #### 2 #### 707 709 374 448 5152 41598 15215 11866 51978 24203 2337 32962 352565 258413 82433 406071 29204 19178 960 9151 176779 105855 24344 5925 -35255 630158 233403 796370 5 17 602 #### 52 2868 17 698 1467 68 298 #### 61 201 51 41 15 Produktions- aktiviteter (branscher) #### #### 960 8663 82 #### 65 61 554 21 257 14 995 53 251 -327 5752 Produktions- faktorer #### 3132 2947 3776 9375 300 -119 #### 70 2 5 349 2322 #### 89 1748 #### Privat kons. Kapitalbildning 6403 1371 163 1167 8742 #### 340 70 342 325 Kapitalf rslitn milj v. L pande transakt. (import) Kapitaltransaktioner Utlandet 8670 1453 395 #### #### 421494 Total CO2 SO2 Nox VOC NH3 #### #### 2337 #### #### #### #### #### 960 9151 #### #### 70 3132 2947 1199 15 3776 9375 300 -119 #### 14 28 #### 1 2322 9 #### 4 #### 5 2 796370 #### 14 749 6 102 308 1 ### 473292 311 271 251 2 5 349 410 89 1748 34 666 45 42 667 502 59 27 756 585 45
Relevant transaction data in the SNA Regular reporting from NSO:s is not in place. However, the SNA contains the on-budget transactions that are of interest. The System of National Account (SNA) subsidy definition is too narrow: only current transfers to industry are included. Capital transfers to industry (investment grants) and transfers to households data needed too. The fossil fuel transactions from the state budget can be identified for the industries to which transfers are allocated.
SEEA fossil fuel transfers 1.On-budget transfers: from the state to industry (as SNA subsidy definition), but also including transfers to international beneficiaries, households as well as capital transfers (investment grants) 2.Preferential tax treatment transfers: can be estimated with extra data on energy taxes paid by industry, combined with energy use or carbon dioxide emissions by industry. Or with national or international price reference. 3.Undertaxed external effects: Emissions by industry from SEEA can be a first step.
Preferential tax treatment: Energy tax and fuel use by industry 01-05 Agriculture, fishing & forestry 10-14 Mining & quarrying 15-37 Manufacturing 40-41 Elect., gas & w ater % of total energy tax on fuel 45 Construction Industries 50-52, 55 Wholesale, retail trade % of total consumption of fuel (GWh) 60-64 Transp. & communication 65-67Financial intermediation 70-99 Other Private consumption Public consumption 0% 10% 20% 30% 40% 50% 60% 70% Percent
Off-budget fossil fuel subsidies External costs of emissions can be calculated if there is a reference value. The emissions could be provided from the accounts, and with international reference values (such as those that IMF have used from regional markets or from damage costs) internationally comparable numbers could be provided from national statistics. To calculate the estimates two reference levels could be tested. One region specific and one internationally relevant reference.
A tentative table for SEEA fossil fuel transactions Agric, fishing, forestry Indust. Energy Transp. Public org Households Nace A. On- budget Current transfers $ Capital transfers $ B. Off- budget Preferential tax treatments $ Data for external cost reference, Tonnes
Way forward We suggest to create a group of experts to discuss following items (via web) during 2018, using method proposed by the Expert group led by UN Environment as a starting point. 1. Discuss and test the measurement definition for the transactions of interests subsidies, investment grants and social transfers in kind, indirect transactions: as well as some suggested reference values 2. Evaluate and adjust proposal 3. Propose an approach to the SEEA discuss the proposal at UNEP/London group 2018/2019 4. Go through established process: SEEA Technical Committee and UNCEEA and publish on SEEA website.
Question to the London group participants Would you agree to search your data systems for these transactions to make some pilot analyses? Can you see that there would be good practices that we can follow from your country?