Climate Water Energy Impacts Scenarios & Risk Management
Explore statistical learning applied to climate-water-energy impacts, scenarios, risk assessment, and management strategies. Understand the influences of hydrological stress and wildfire on multisector dynamics in the Western US. Address uncertainties in future climate, power grid changes, and infrastructure resilience planning. Analyze impact scenarios and detect common patterns in outcomes using K-means clustering.
Download Presentation

Please find below an Image/Link to download the presentation.
The content on the website is provided AS IS for your information and personal use only. It may not be sold, licensed, or shared on other websites without obtaining consent from the author. If you encounter any issues during the download, it is possible that the publisher has removed the file from their server.
You are allowed to download the files provided on this website for personal or commercial use, subject to the condition that they are used lawfully. All files are the property of their respective owners.
The content on the website is provided AS IS for your information and personal use only. It may not be sold, licensed, or shared on other websites without obtaining consent from the author.
E N D
Presentation Transcript
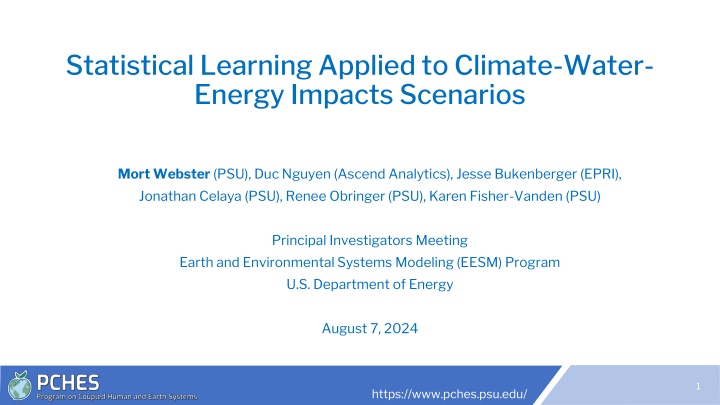
Statistical Learning Applied to Climate-Water- Energy Impacts Scenarios Mort Webster (PSU), Duc Nguyen (Ascend Analytics), Jesse Bukenberger (EPRI), Jonathan Celaya (PSU), Renee Obringer (PSU), Karen Fisher-Vanden (PSU) Principal Investigators Meeting Earth and Environmental Systems Modeling (EESM) Program U.S. Department of Energy August 7, 2024 1 https://www.pches.psu.edu/
Managing Uncertainty: Scenarios Risk Assessment: Simulation Scenario Generation Scenario Reduction Risk Management: Optimization 2 https://www.pches.psu.edu/
PCHES-ADAPT: visual project overview (Western US Case Study) We seek to understand the multisector dynamics (MSD) influences on cascading risks associated with hydrological stress and wildfire in the U.S. West How do human and institutional responses to drought and wildfire to heighten or mitigate risk to the MSD system? To what extent can adaptive and resilient strategies mitigate these risks? 3 https://www.pches.psu.edu/
Hydrology-Power-Economy Impact Example Impacts, teleconnections for one future scenario Example: Future climate forcing Higher surface water temperatures Higher water temperatures Forced power plant outage Power rerouted Transmission congestion Unmet electricity demand Distant from the forced outages 4 https://www.pches.psu.edu/
Hydrology-Power-Economy Impact Scenarios 324 scenarios of future climate, hydrology, and changes to power grid Greatest unserved demand results from a range of water temperatures and retired capacities Infrastructure Resilience Planning: System operators must plan now: Where to produce power Where to add transmission lines The same range of water temperatures and retired capacities may have smaller impacts Uncertainty: Alternative futures must be planned for We can create many scenarios Motivating Questions: How can I organize the many possible futures? Do I need to simulate every scenario? Do planners need to consider every scenario? 5 https://www.pches.psu.edu/
Step 1: Detect Common Patterns in Outcomes Apply K-means clustering to: Electricity Prices Transmission Congestion Finding: Many scenarios of failure But only four distinct geographic patterns Electricity Prices Red (Highest) Pink Green Blue Black (Lowest) 6 https://www.pches.psu.edu/
Step 2: Apply Statistical Models for Prediction Next Question: How can I know which group a scenario s outcomes will belong to without simulating it? Method: Classification Tree Partitions data set (all scenarios) by predictor data to differentiate groups (i.e., partition into 2 groups by one variable, then partition again based on another variable, etc.). Because of randomness, ambiguity, no one tree will be a perfect predictor Better Method: Random Forest Independently fit MANY classification trees Use the weighted average of all trees to predict group from a scenario Representative Tree Cannot visualize a random forest: good predictor but black box Find a single tree that is minimum distance from all trees in random forest 7 https://www.pches.psu.edu/
Example Classification Tree for 324 Scenarios Total of (actual) observations: 174 group 0 observations 26 group 1 observations 31 group 2 observations 12 group 3 observations 8 https://www.pches.psu.edu/
Step 3: Test whether the Clusters are Useful for Adaptation Reference case versus transmission upgrades NSE change 800 Non-served Electricity Demand (MW) 700 600 500 400 300 200 100 0 103 109 115 121 127 133 139 145 151 157 163 13 19 25 31 37 43 49 55 61 67 73 79 85 91 97 1 7 Hour Reference case Added Transmission Capacity Example: Select one scenario from Group N Double transmission capacity for congested lines -> reduction in unmet electricity demand Test the same change for other scenarios in Group N Verify that the unmet energy is also reduced in these scenarios (yes, it is!). 9 https://www.pches.psu.edu/
Quick Summary Where will future transmission lines be? Starting point: Unlimited number of high-resolution scenarios Easy to create scenarios Hard to simulate all of them in model Even harder to know what to do with the results afterwards 1. How do I organize large set of scenarios? Cluster into groups with similar outcome patterns 2. How can I predict which group a new scenario will belong to? Statistical learning tools (Random Forest) 3. What to provide to infrastructure planners? Representative scenarios from each impact pattern group 10 https://www.pches.psu.edu/
Questions? This work was supported by the U.S. Department of Energy, Office of Science, Biological and Environmental Research Program, Earth and Environmental Systems Modeling, MultiSector Dynamics under Cooperative Agreement DE-SC0022141. 11 https://www.pches.psu.edu/


