Clustering Algorithms
Using clustering algorithms for structure discovery in data points, without prior knowledge of the structure. Exploring k-Means and other clustering techniques to group data points based on similarities. Illustrations and explanations included.
Download Presentation

Please find below an Image/Link to download the presentation.
The content on the website is provided AS IS for your information and personal use only. It may not be sold, licensed, or shared on other websites without obtaining consent from the author.If you encounter any issues during the download, it is possible that the publisher has removed the file from their server.
You are allowed to download the files provided on this website for personal or commercial use, subject to the condition that they are used lawfully. All files are the property of their respective owners.
The content on the website is provided AS IS for your information and personal use only. It may not be sold, licensed, or shared on other websites without obtaining consent from the author.
E N D
Presentation Transcript
Week 7 Video 1 Clustering
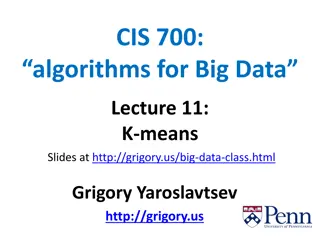
Clustering A type of Structure Discovery algorithm This type of method is also referred to as Dimensionality Reduction, based on a common application
Clustering You have a large number of data points You want to find what structure there is among the data points You don t know anything a priori about the structure Clustering tries to find data points that group together
Trivial Example Let s say your data has two variables Probability the student knows the skill from BKT (Pknow) Unitized Time Note: clustering works for (and is effective in) large feature spaces
+3 time 0 -3 0 1 pknow
k-Means Clustering Algorithm +3 time 0 -3 0 1 pknow
Not the only clustering algorithm Just the simplest We ll discuss fancier ones as the week goes on
How did we get these clusters? First we decided how many clusters we wanted, 5 How did we do that? More on this in the next lecture We picked starting values for the centroids of the clusters Usually chosen randomly Sometimes there are good reasons to start with specific initial values
+3 time 0 -3 0 1 pknow
Then We classify every point as to which centroid it s closest to This defines the clusters Typically visualized as a voronoi diagram
+3 time 0 -3 0 1 pknow
Then We re-fit the centroids as the center of the points in each cluster
+3 time 0 -3 0 1 pknow
Then Repeat the process until the centroids stop moving Convergence
+3 time 0 -3 0 1 pknow
+3 time 0 -3 0 1 pknow
+3 time 0 -3 0 1 pknow
+3 time 0 -3 0 1 pknow
+3 time 0 -3 0 1 pknow
Note that there are some outliers +3 time 0 -3 0 1 pknow
What if we start with these points? +3 time 0 -3 0 1 pknow
Not very good clusters +3 time 0 -3 0 1 pknow
What happens? What happens if your starting points are in strange places? Not trivial to avoid, considering the full span of possible data distributions
One Solution Run several times, involving different starting points cf. Conati & Amershi (2009)
Exercises Take the following examples (The slides will be available in course materials so you can work through them) And execute k-means for them Do this by hand Focus on getting the concept rather than the exact right answer (Solutions are by hand rather than actually using code, and are not guaranteed to be perfect)
Exercise 7-1-1 +3 time 0 -3 0 1 pknow
Pause Here with In-Video Quiz Do this yourself if you want to Only quiz option: go ahead
Solution Step 1 +3 time 0 -3 0 1 pknow
Solution Step 2 +3 time 0 -3 0 1 pknow
Solution Step 3 +3 time 0 -3 0 1 pknow
Solution Step 4 +3 time 0 -3 0 1 pknow
Solution Step 5 +3 time 0 -3 0 1 pknow
No points switched -- convergence +3 time 0 -3 0 1 pknow
Notes K-Means did pretty reasonable here
Exercise 7-1-2 +3 time 0 -3 0 1 pknow
Pause Here with In-Video Quiz Do this yourself if you want to Only quiz option: go ahead
Solution Step 1 +3 time 0 -3 0 1 pknow
Solution Step 2 +3 time 0 -3 0 1 pknow
Solution Step 3 +3 time 0 -3 0 1 pknow
Solution Step 4 +3 time 0 -3 0 1 pknow
Solution Step 5 +3 time 0 -3 0 1 pknow
Notes The three clusters in the same data lump might move around for a little while But really, what we have here is one cluster and two outliers k should be 3 rather than 5 See next lecture to learn more
Exercise 7-1-3 +3 time 0 -3 0 1 pknow
Pause Here with In-Video Quiz Do this yourself if you want to Only quiz option: go ahead
Solution +3 time 0 -3 0 1 pknow
Notes The bottom-right cluster is actually empty! There was never a point where that centroid was actually closest to any point
Exercise 7-1-4 +3 time 0 -3 0 1 pknow
Pause Here with In-Video Quiz Do this yourself if you want to Only quiz option: go ahead
Solution Step 1 +3 time 0 -3 0 1 pknow
Solution Step 2 +3 time 0 -3 0 1 pknow
