Code Architecture of a Mid-Term Trading Strategy
This architecture outlines a hypothesis for mid-term trading opportunities in US stocks with high momentum and low risk. It suggests tools like RStudio, data.table, quantmod, and performance analytics for data processing and analysis. Historical data download and preprocessing steps are detailed to ensure model accuracy. The strategy aims for profitable returns with low initial capital through systematic stock analysis and backtesting.

Download Presentation

Please find below an Image/Link to download the presentation.
The content on the website is provided AS IS for your information and personal use only. It may not be sold, licensed, or shared on other websites without obtaining consent from the author.If you encounter any issues during the download, it is possible that the publisher has removed the file from their server.
You are allowed to download the files provided on this website for personal or commercial use, subject to the condition that they are used lawfully. All files are the property of their respective owners.
The content on the website is provided AS IS for your information and personal use only. It may not be sold, licensed, or shared on other websites without obtaining consent from the author.
E N D
Presentation Transcript
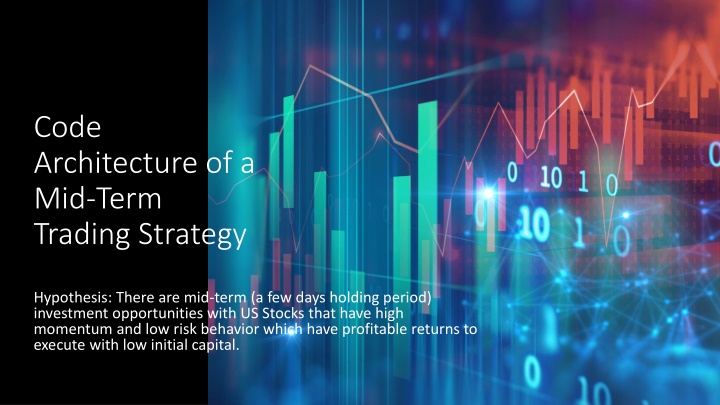
Code Architecture of a Mid-Term Trading Strategy Hypothesis: There are mid-term (a few days holding period) investment opportunities with US Stocks that have high momentum and low risk behavior which have profitable returns to execute with low initial capital.
Recommended Tools Rstudio interactive R environment Data.table fast way to store, access and transform large datasets Foreach / doParallel parallel processing framework for data processing xts / quantmod / TTR / QuantStrat / PerformanceAnalytics / blotter great finance toolset for time series data, indicator calculation, backtesting and of the results Ranger multi threaded random forest framework Ggplot2 easily plot charts to analyze data Tradingview stock charts and analysis Custom built PC w/ threadripper
Architecture Diagram
Initialize Data Download Historical Data How much data to gather? Depends on the strategy, should be enough to setup 60% for training model, 40% for oos, with multiple bootstrapped backtest periods with dozens to hundreds of trades each. Download Historical Stock price data I was able to download historical 1m bar data for thousands of stocks in a few minutes using foreach/dopar against Polygon (peak 16k calls per second) Download any other historical point in time alt data (macro economic indicators or industry growth rates for example) Ensure you will be able to programmatically download this data ongoing to run the model in production
Initialize Data Clean and Pre-Process Data Quality Look for jumps using lead/lag data.table functions Look for gaps in similar way by comparing the date differences within the same symbol Action on the DQ review multiple vendors, manually fix data, filter data out? Pre-Processing Every symbol will not have data for every period, you could create rows for every period for every symbol and carry data forward using na.locf if desired. Could use na.locf to fill any data forward regardless Ensure there are no duplicates Filter to the times that make most sense, if you chose hourly, filter to only hours, in case some data came in outside of that expectation. Can filter to only market hours or could include before/after hours data. Would it impact the indicators and make it more challenging for the model to find patterns? Relative vs Absolute data representation. Some indicators might not mean much on their own without more context. MACD for instance will have a different scale for every company, so you would want to use a value that represents the increase relative to itself over the recent history
Calculate Indicators & Target Variables Possible to use multiple periodicity of the same data via to.period to capture fast and slow moving patterns TTR for technical indicators ensure the metrics don t include future data Try to explain the pattern to a computer Common technical indicator types: trend, mean reversion, relative strength, volume, and momentum Could also think of the problem as filters volume needs to meet execution requirements, risk needs to meet risk appetite, momentum needs to meet strategy style requirements Could use classification on top of technical indicators to generalize the behaviors Consider some extreme values may not work well with models and winsorizing indicator values may be easier for models to understand Could include calculations from disparate data to explain the behavior of the economy or industry at the point in time, or social growth, etc. Predict Target Variable: Return after n days, max return, min return, future drawdown, sharpe, etc
Build Model Structure Data for modeling & backtesting Ranger is a great random forest model in R with parallelization Its also possible to structure the data with rolling windows for more recent data in training Purpose for the model is to predict the target variables as accurately as possible, then utilize those predictions to sort & filter the data for backtesting Variable importance and correlations can be good tools for feature selection, its also possible to combine multiple features together in more general classifications. PCA can be used as well. Test multiple model hyperparameters for most generalized and accurate model It is useful to validate the model accuracy by using box plots or other graphs to compare top n % rank of the predicted value with future return data
Run Backtest Test minimal variations of the backtest, only enter this step after high confidence that the model, sorts and filters will lead to profitable returns Trading Strategies vs Portfolio Strategies, could augment the backtest to select a set number of symbols at specific cadence with additional objective to reduce risk I ve found it useful to backtest multiple periods of time to see the variety of expectations of the strategy. I find it easiest to prepare the dataset with values that indicate entry and exit signals based on predicted values and filters. Example: enter a trade when it has enough momentum, volume, and is predicted to have returns in the top 5% of the time horizon. It s useful to record metrics for the backtest to compare variations and time periods: rows, sharpe, trades, drawdown, equity. PerformanceAnalytics and Blotter work great to get detailed trade information and resulting returns and risk data from the backtest trades. If a strategy produces consistent results that meet the requirements, then move forward to strategy execution, else go back a few steps and figure out why there is a difference in results between the steps.
Execute Strategy Structure the code to run against the latest data Run all previous steps against latest data Ensure the incremental process produces the same results as the historical processes Ensure the code runs fast enough to execute the strategy, example: if it takes 2 hours to run, but the trades need to happen every 5 minutes, it won t work Near-realtime may require websocket continuous data downloading in order to process fast enough, but that adds a lot of additional complexity Execute strategy against paper trading and ensure results match backtest results against the same period to ensure the processing is all happening correctly Store many logs about the executions and decision processes for later review to ensure the model and processes are working as expected


![Guardians of Collection Enhancing Your Trading Card Experience with the Explorer Sleeve Bundle [4-pack]](/thumb/3698/guardians-of-collection-enhancing-your-trading-card-experience-with-the-explorer-sleeve-bundle-4-pack.jpg)