Code for Formatting NARR Atmospheric Model Data
"Learn how to read and format output data from NARR Atmospheric Model in NetCDF with Matlab script. Extract wind vectors and atmospheric pressure subset tailored for WAVE and Hydrodynamic models. Request the script for your project needs."

Download Presentation

Please find below an Image/Link to download the presentation.
The content on the website is provided AS IS for your information and personal use only. It may not be sold, licensed, or shared on other websites without obtaining consent from the author. If you encounter any issues during the download, it is possible that the publisher has removed the file from their server.
You are allowed to download the files provided on this website for personal or commercial use, subject to the condition that they are used lawfully. All files are the property of their respective owners.
The content on the website is provided AS IS for your information and personal use only. It may not be sold, licensed, or shared on other websites without obtaining consent from the author.
E N D
Presentation Transcript
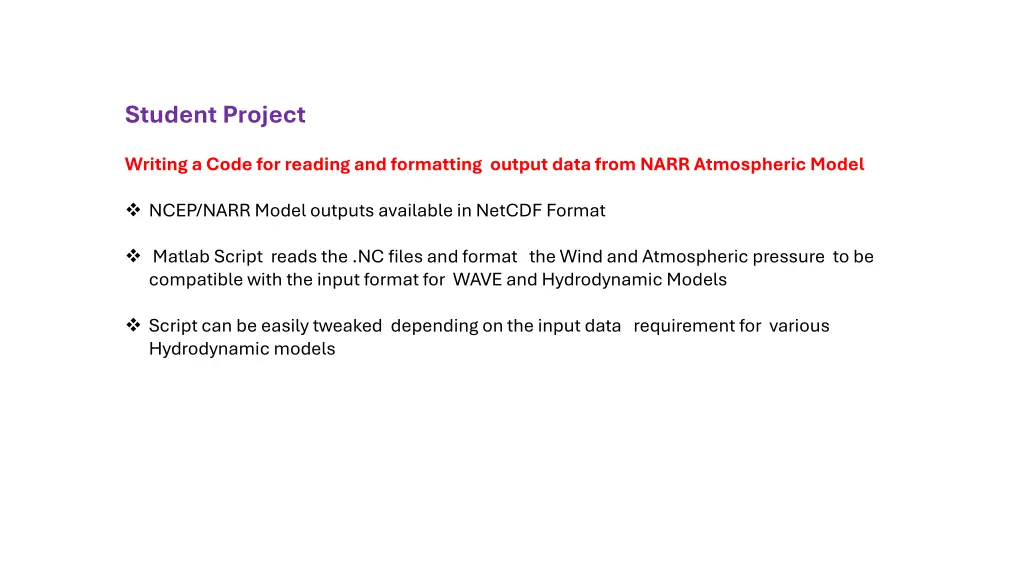
Student Project Writing a Code for reading and formatting output data from NARR Atmospheric Model NCEP/NARR Model outputs available in NetCDF Format Matlab Script reads the .NC files and format the Wind and Atmospheric pressure to be compatible with the input format for WAVE and Hydrodynamic Models Script can be easily tweaked depending on the input data requirement for various Hydrodynamic models
Extracting a subset of times series of wind vectors and atmospheric pressure from the NARR/NCEP Model
Matlab Script clear all; clc; %Reading the NARR Computational Grid cooridnates, 221 % fid1 = fopen('G:\BATON\SHIP_SHOAL\MODELING\MMS\narr_latlong.g221','r'); % A = fscanf(fid1, '%d %d %f %f', [4 inf]); % fclose (fid1); % A=A'; % xcord =A(:,4); % ycord = A(:,3); % k= length(xcord); % X= reshape(xcord,349,277); % Y= reshape(ycord,349,277); % X= -X; %grid for the Gulf of Mexico (model domain) x= -98:0.0625:-79; % normal resolution (0.0625 > double) y= 18:0.0625:31.5; % normal resolution ().0625 > double) [YI,XI]= meshgrid(y,x); YYI= rot90(YI); %for plotting purpose only XXI= rot90(XI);
fprintf(fid10, '"Title" "U & V wind components and surface pressure"\n'); fprintf(fid10,'"Dim" 2\n'); fprintf(fid10,'"Geo" "LONG/LAT" -98 18 0\n'); fprintf(fid10,'"Time" "EqudistantTimeAxis" "%s" "00:00:00" %s %s\n',dq,sf,si); fprintf(fid10,'"NoGridPoints" 305 217\n'); fprintf(fid10,'"Spacing" 0.0625 0.0625\n'); fprintf(fid10,'"NoStaticItems" 0\n'); fprintf(fid10,'"NoDynamicItems" 3\n'); fprintf(fid10,'"Item" "u-vel" "u-velocity component" "m/s"\n'); fprintf(fid10,'"Item" "v-vel" "v-velocity component" "m/s"\n'); fprintf(fid10,'"Item" "pres" "pressure" "hpa"\n'); fprintf(fid10,'NoCustomBlocks 1\n'); fprintf(fid10,'"M21_Misc" 1 7 0 -1E-030 -900 10 -1E-030 -1E-030 -1E-030\n'); fprintf(fid10,'"Delete" -1E-030\n'); fprintf(fid10,'"DataType" 0\n');