Cohort Effects and Changing Distributions in Health Studies
This study by Adam Hulm explores cohort effects in health status, analyzing age-related trajectories and longitudinal data to investigate how different birth cohorts are exposed to unique environments affecting health outcomes. Utilizing a multilevel model, the research incorporates cohort effects and assesses various cardiovascular risk factors.

Download Presentation

Please find below an Image/Link to download the presentation.
The content on the website is provided AS IS for your information and personal use only. It may not be sold, licensed, or shared on other websites without obtaining consent from the author.If you encounter any issues during the download, it is possible that the publisher has removed the file from their server.
You are allowed to download the files provided on this website for personal or commercial use, subject to the condition that they are used lawfully. All files are the property of their respective owners.
The content on the website is provided AS IS for your information and personal use only. It may not be sold, licensed, or shared on other websites without obtaining consent from the author.
E N D
Presentation Transcript
COHORT EFFECTS & CHANGING DISTRIBUTIONS Adam Hulm n (LEAD member) Department of Medical Physics and Informatics University of Szeged, Hungary LEAD 2014 e-mail: hulman.adam@med.u-szeged.hu
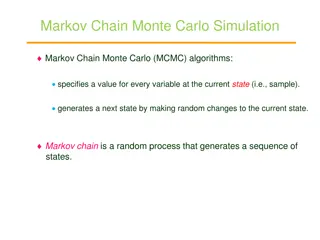
Cohort effect (definition) 1 Variation in health status that arises from the different causal factors to which each birth cohort in the population is exposed as the environment and society change. Each consecutive birth cohort is exposed to a unique environment that coincides with its life span. (Dictionary of Epidemiology) period and age effects interact to create cohort effects (Keyes et al., Soc Sci Med 2010;70:1100-1108)
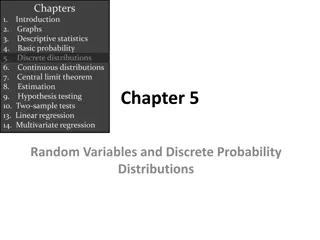
Problem definition 2 Longitudinal dataset Continuous outcome Explanatory variables (continuous!) Age Year of birth (YOB) Linear dependence! Calendar year (CY) How to analyze change over time?
Aim (1) 3 To assess age-related trajectories and to investigate cohort effects simultaneously
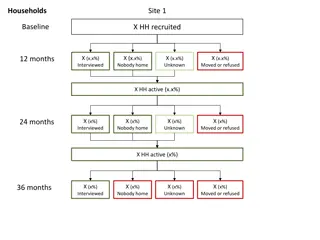
Study population 4 Whitehall II study 10,308 participants (67% men) 1985-2009 Clinical examination every 5 years Up to 5 measurements within individuals Outcomes: cardiovascular risk factors
Multilevel model 5 General model formulation Level-1 yij=p0i+p1i Ageij+p2i Ageij Level-2 2+eij p0i=g00+z0i p1i=g10+z1i p2i=g20+z2i Random effects (not necessary to include all) Fixed effects
Incorporate cohort effects 6 Incorporate cohort effects YOB (time-invariant) or CY (time-variant) yij=p0i+p1i Ageij+p2i Ageij p0i=g00+g01 YOBi+z0i p1i=g10+g11 YOBi p2i=g20+g21 YOBi 2+eij
Composite model formulation 7 yij=g00+g01 YOBi+(g10+g11 YOBi) Ageij+(g20+g21 YOBi) Ageij 2 =g00+g01 YOBi+g10 Ageij+g11 YOBi Ageij+g20 Ageij 2+g21 YOBi Ageij 2 (only the fixed effects are displayed) We used the model to analyze the following risk factors: Body mass index (BMI) Waist circumference (WC) Systolic blood pressure (SBP) Diastolic blood pressure (DBP) Total cholesterol (TC) High-density lipoprotein (HDL)
BMI and DBP (men) 8 BMI and DBP as a function of Age (and YOB) Birth cohort: 1933 ( ), 1938 ( ), 1943 ( ), 1948 ( ) and unadjusted for YOB (---) Results for other variables stratified by sex in: Hulm n et al., Int J Epidemiol 2014;doi:10.1093/ije/dyt279
Multilevel models - summary 9 +Flexibility (number of measures, missing data) +Interpretation is similar to OLS regression +Availability of software packages (e.g. R: lme4) - Focus on the mean - Assumptions (normality)
Change from a different aspect 10 Limitation of regression models focusing on the mean More results on BMI, but limited evidence on other risk factors
Aim (2) 11 To characterize the change of distributions
Sequential cross-sectional analysis (WH II) 12 Age-group: 57-61 Percentiles + Linear trend (quantile regression) *** P<0.001 Source: Hulm n et al., Int J Epidemiol 2014;doi:10.1093/ije/dyt279 Table 3, page 5
Sequential cross-sectional analysis 13 Density plots (PDF of smooth kernel distribution) Phases: 3 (dotted), 5 (dashed), 7 (solid), 9 (thick) Source: Hulm n et al., Int J Epidemiol 2014;doi:10.1093/ije/dyt279 Figure 1, page 6
BMI (Razak et al.) 14 Low- and middle income countries 1991-2008 732,784 women from 37 countries Source: Razak et al., PLOS Med 2013; 10(1): e1001367. Figure 4, page 11 (doi:10.1371/journal.pmed.1001367.g004)
BMI (Razak et al.) 15 Source: Razak et al., PLOS Med 2013; 10(1): e1001367. Figure 3, page 9 (doi:10.1371/journal.pmed.1001367.g003)
BMI (Bottai et al.) 16 Aerobics Center Longitudinal Study 1970-2006 74,473 BMI repeated measures from 17,759 men with 2 visits Stratified by physical activity (PA)
BMI (Bottai et al.) 17 PA: active (dashed) Inactive (solid) Source: Bottai et al., Obesity 2013; doi:10.1002/oby.20618. Figure 2, page 5
Summary and conclusions 18 Cohort effects should be considered when analyzing change over a long period of time Adjustment for continuous variables Methods beyond mean regression Visualization (QQ and density plot) Quantile regression
References 19 Singer JD, Willett JB, Applied longitudinal data analysis: modeling change and event occurrence Oxford University Press 2003, ISBN-13 978-0-19-515296-8 Hulm n A, Tab k AG, Ny ri TA, et al., Effect of secular trends on age-related trajectories of cardiovascular risk factors: the Whitehall II longitudinal study Int J Epidemiol 2014;doi:10.1093/ije/dyt279 Razak F, Corsi DJ, Subramanian SV, Change in the body mass index distribution for women: analysis of surveys from 37 low- and middle-income countries PLOS Med 2013; 10(1): e1001367. Bottai M, Frongillo EA, Sui X, et al., Use of quantile regression to investigate the longitudinal association between physical activity and body mass index Obesity 2013;doi:10.1002/oby.20618
Acknowledgments 20 The Leadership in Epidemiological Analysis of longitudinal Diabetes-related data (LEAD) Consortium

")

")


")


")
")

")
")
")
")