Cohort Study and Person-Time Incidence Rate

A cohort study by Prof. Jasim N. Al-Asadi highlights the definitions, objectives, and calculations of person-time incidence rate. Learn about prevalence, incidence, and the uses of such epidemiological studies.

Download Presentation

Please find below an Image/Link to download the presentation.
The content on the website is provided AS IS for your information and personal use only. It may not be sold, licensed, or shared on other websites without obtaining consent from the author.If you encounter any issues during the download, it is possible that the publisher has removed the file from their server.
You are allowed to download the files provided on this website for personal or commercial use, subject to the condition that they are used lawfully. All files are the property of their respective owners.
The content on the website is provided AS IS for your information and personal use only. It may not be sold, licensed, or shared on other websites without obtaining consent from the author.
E N D
Presentation Transcript
COHORT STUDY PROF. JASIM N. AL-ASADI 2018 - 2019
Objectives At the end of this lecture, students will be able to: 1. define cohort and cohort study 2. organize a cohort study 3. Describe selection of the study groups 4. demonstrate the advantages and disadvantages of cohort studies
Basic definitions Person-time incidence rate (Synonyms: incidence density) It is a measure of incidence that incorporates time directly into the denominator. A person-time rate is generally calculated from a long-term cohort follow-up study, wherein participants are followed over time and the occurrence of new cases of disease is documented. It is usually used when disease is rare. In certain studies people are followed for different lengths of time, as some will remain disease-free longer than others. It is the proportion of individuals who experience the event in a defined time period (E/N during some time T) E= Events N= Number T= Time
Calculation of Person- time IR Calculating rates The rate is the number of new (incident) cases during study follow-up divided by the person-time-at risk throughout the observation period.
o IR= 3/100= 0.03 Person-year 0R 3% person-year
Understanding incidence and prevalence: the bathtub example Death or recovery Point prevalence is the balance between inflow to the prevalence pool (incidence) and outflow (e.g. recovery and/or mortality). Prevalence Rate = Incidence Rate x Mean Duration
USES OF INCIDENCE AND PREVALENCE 1. Incidence is generally used for acutely acquired diseases, prevalence is used for more permanent states, conditions or attributes of ill-health. 2. Incidence is more important when thinking of etiology of the disorder,prevalence when thinking of societal burden of the disorder including the costs and resources consumed as a result of the disorder. Incidence always requires a duration, prevalence may or may not.
Types of epidemiological studies 1. OBSERVATIONAL STUDIES A. Descriptive study: Describe disease by: Time Place Person A. Analytical studies Ecolological study Analytical cross sectional study Case control study Cohort study 2. EXPEREMENTAL STUDIES [Compare treatment modalities] Randomized controlled study [RCT] Field trial Community Suggest a hypothesis Examine pattern of disease Test a hypothesis (study suspected causes)
Hierarchy of Epidemiologic Study Design Tower & Spector, 2007 (www)
Epidemiologic Study Designs Grimes & Schulz, 2002 (www)
Cohort studies Group by common characteristics Start with a group of subjects who lack a positive history of the outcome of interest yet are at risk for it (cohort). Think of going from cause to effect. The exposure of interest is determined for each member of the cohort and the group is followed to document incidence in the exposed and non- exposed members.
WHAT IS COHORT cohors (Latin word) = Refers to warriors and gives notion of a group of persons proceeding or banded together in time Epidemiologically: a group of persons with a common statistical characteristic. e.g. age, birth date, smoking
Indications of a cohort study When good evidence suggests an association of a disease with a certain exposure or exposures. When exposure is rare but incidence of disease is higher among exposed When follow-up is easy, and the cohort is stable When sufficient funds (financial support) are available
Types of cohort studies Prospective cohort characterized by determination of exposure levels (exposed vs. not exposed) at baseline (present) and followed for occurrence of disease in future Groups move through time as they age Retrospective - makes use of historical data to determine exposure level at some baseline in the past and then determine subsequent disease status in the present. Restricted - limited exposure, narrow behavior (military, longshoremen)
Prospective studies Also called Longitudinal Follow up Prospective Incidence studies Looking into the future Example: Framingham Study of coronary heart disease (CHD)
Definition & Synonyms of prospective cohort study Definition The cohort study is an observational analytic epidemiological study which attempts to study the relationship (association) between a proposed risk factor (exposure) and the subsequent risk of developing disease. Synonyms Follow-up Longitudinal Prospective Incidence study
The cohort design (Prospective) Starts with people free of disease Assesses exposure at baseline Assesses disease status at follow-up A definite beginning and end
Cohort study Develop Disease Exposed to RF Do not develop disease People without the outcome or disease Population Develop Disease Not Exposed to RF Do not develop disease Time Direction of enquiry
Retrospective cohort studies Disease occurrence Study starts Exposure time
Cohort Study Design Types of Cohorts Fixed Cohort A group of individuals recruited and enrolled at a uniform point in the natural history of a disease or by some defining event Cohort does not take on new members after it is assembled Examples Patients admitted to the ER with acute MI Survivors of Hiroshima bombings Children born to HIV-infected mothers
Cohort Study Design Type of Cohorts Open cohort A group of individuals recruited and enrolled through a mechanism that allows for in and out migration of people Defined by characteristic other than disease, e.g., geographic location, administrative unit Dynamic population Examples Framingham Study
Cohort studies Fixed Cohort X = outcome x (+) x Exposure (-) x
Cohort studies Dynamic X = outcome X X (+) Exposure X X (-) Years
Elements of cohort study Elements of cohort study Selection of study subjects Selection of comparison group Obtaining data on exposure Follow up Analysis
1 1. Selection of the cohort groups . Selection of the cohort groups General consideration while selection of cohort groups Both the cohort study group (exposed) and controls (non-exposed) are free of the disease Both groups should be equally susceptible to disease Both groups should be comparable Diagnostic criteria for the disease should be defined well early
A. Selection A. Selection of study subjects of study subjects General population Whole population in an area A representative sample Special group of population Selected group Occupation group / professional group Exposure groups Person having exposure to some physical, chemical or biological agent e.g. X-ray exposure (radiologists)
B. Selection B. Selection of comparison of comparison group Internal comparison Only one cohort involved in study Sub classified and internal comparison done (e.g. smoking intensity) External comparison More than one cohort in the study for the purpose of comparison e.g. Cohort of radiologists compared with ophthalmologists Comparison with general population rates If no comparison group is available, we can compare the rates of study cohort with the general population. Cancer rate of uranium miners with cancer in general population group
2 2. Obtaining . Obtaining data on exposure data on exposure This can be achieved by: Personal interviews /mailed questionnaires Reviews of records Dose of drug, radiation, type of surgery ...etc Medical examination or special test Blood pressure, serum cholesterol Environmental survey By obtaining the data of exposure, we can classify cohorts as: Exposed and non exposed, or By degree of exposure, we can sub- classify cohorts into: Mild, moderate, and high exposure
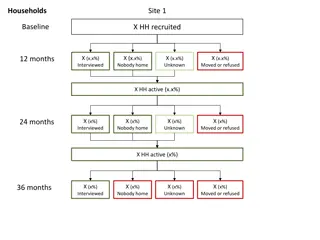
3 3. Follow . Follow- -up up To obtain data about outcome to be determined (morbidity or death) Mailed questionnaires, telephone calls, personal interviews Periodic medical examination Reviewing records Surveillance of death records Follow up is the most critical part of the study Some loss to follow up is inevitable due to death, change of address, migration, change of occupation. Loss to follow-up is one of the draw-backs of the cohort study.
ANALYSIS ANALYSIS Calculation of incidence rates among exposed and non exposed groups Estimation of risk
1. Standard 2 x 2 table Disease status Do not develop Develop Total Exposed a b a + b Exposure to risk factor Non- Exposed c d c + d
2. Calculation of Incidence rates Incidence rate among exposed = a/ a+b x1000 Disease status Do not develop Develop Total Exposure to RF Exposed a b a + b Not Exposed c d c + d Incidence rate among non-exposed = c/ c+d x 1000
3. Estimation of Relative risk Relative Risk (RR): It is a measure of strength of association between risk factor and outcome. Incidence rate of disease among exposed RR = Incidence rate of disease among non-exposed a/a+b x 1000 RR = c/c+d x 1000
Interpretation of Relative Risk (RR) Interpretation of Relative Risk (RR) RR=1: No association between exposure and disease. The incidence rates are identical between groups RR> 1: Positive association (increased risk) The exposed group has higher incidence than unexposed group RR< 1: Negative association (protective effect) The unexposed group has higher incidence than exposed group
Guide to the strength of an epidemiological association Relative risk 1.0 > 1.0 - < 1.5 1.5 3.0 3.1 10.0 > 10 strength of association None Weak Moderate Strong Infinite
4. Estimation of Attributable Risk Attributable Risk: It is the fraction of risk that can be attributed to the exposure to risk factor under study. = IR of disease among exposed IR disease among non exposed
5. Attributable risk percent [Percentage of reduction] Among exposed, what percent of the total risk of disease is due to the exposure and can be reduced if the risk factor is eliminated. AR% (Exposed) [ Percentage of reduction] [IR (Exposed) IR (Unexposed)] = X 100 IR (Exp)
Find out RR and AR for the following data Smoking Hypertension Total IR(exposed)=8/200 x 1000= 40/1000 YES NO IR(non-exposed=4/200 x 1000=20/1000 YES 8 192 200 RR= 40/20= 2 AR= 40-20=20/1000 NO 4 196 200 AR% (Percent of reduction)= 40-20/40 x100= 50% 12 388 400
Advantages of cohort study Can measure incidence and risks An efficient method of studying rare exposures Assesses multiple outcomes of a single exposure Establishes temporal relationship between exposure and outcome (Exposure happened before outcome ) Low potential for bias [Avoids recall bias]. Does not require strict random assignments of subjects Best observational design to establish association
Disadvantages Very large sample sizes, especially for rare outcomes Expensive and time-consuming Loss to follow-up Bias in ascertainment of diagnosis Measurement errors, multiple interviews, tests Complexity of data analysis
Causal association Epidemiological criteria Biological criteria (Koch's postulates) 1. Agent is regularly found in the lesion of each case 2. Agent is isolated in pure culture 3. Agent causes similar disease in experimental animals 4. Agent is recovered from lesions in experimental animals
Question Question In a population of 10500 adult persons, the men: women ratio was 1.1:1. Both men and women were followed up for 2 years.1650 men and 20% of women developed hypertension during the follow-up period. A. Is there an association between gender and hypertension. Do appropriate calculations to prove your answer. B. What is the overall annual incidence rate of hypertension in that population? C. If men and women have the same risk of development of hypertension, what will be the expected percentage of reduction in risk of hypertension in the exposed group?
Question Question In a cohort study the relative risk for chronic obstructive pulmonary disease (COPD) for moderate smokers versus non- smokers was 4. For heavy smokers compared to non-smokers the relative risk was 10. What would have been the relative risk for COPD in this study if the heavy smokers were used as the reference category? A. For non-smoking 0.1 and for moderate smoking 0.4 B. For non-smoking 0.2 and for moderate smoking 0.6 C. For non-smoking 4 and for heavy smoking 10 D. For non-smoking 0.4 and for moderate smoking 1 E. This cannot be calculated with the available data


")


")