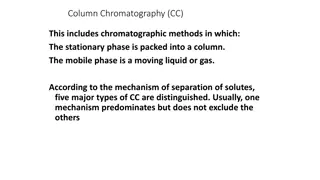
Column Store Index and Batch Mode Scalability
An introduction to the challenges and optimizations for scalability in column store index and batch mode processing, focusing on CPU cache, memory, I/O subsystem latency, cache utilization, sequential versus random page access, advancements in disk technology, and query execution leveraging CPU caches and compression techniques for better performance scalability.

Download Presentation

Please find below an Image/Link to download the presentation.
The content on the website is provided AS IS for your information and personal use only. It may not be sold, licensed, or shared on other websites without obtaining consent from the author.If you encounter any issues during the download, it is possible that the publisher has removed the file from their server.
You are allowed to download the files provided on this website for personal or commercial use, subject to the condition that they are used lawfully. All files are the property of their respective owners.
The content on the website is provided AS IS for your information and personal use only. It may not be sold, licensed, or shared on other websites without obtaining consent from the author.
E N D
Presentation Transcript
Column Store Index and Batch Mode Scalability
About me . . . An independent SQL Consultant A user of SQL Server from version 2000 onwards with 12+ years experience.
The scalability challenges we face . . . . Slides borrowed from Thomas Kejser with his kind permission
CPU Cache, Memory and IO Subsystem Latency Core L1 L2 Core L1 L2 L3 Core L1 L2 Core L1 L2 1ns 10ns 100us 10ms 100ns 10us
C The Cache out Curve Throughput Every time we drop out of a cache and use the next slower one down, we pay a big throughput penalty CPU Cache TLB NUMA Remote Storage Touched Data Size
CPCaches C Sequential Versus Random Page CPU Cache Throughput 1,000 Million Pages/sec 900 800 700 Random Pages 600 Sequential Pages 500 Single Page 400 300 200 100 0 0 2 4 6 8 10 12 14 16 18 20 22 24 26 28 30 32 Size of Accessed memory (MB) Service Time + Wait Time
Moores Law Vs. Advancements In Disk Technology Transistors per square inch on integrated circuits has doubled every two years since the integrated circuit was invented Spinning disk state of play Interfaces have evolved Aerial density has increased Rotation speed has peaked at 15K RPM Not much else . . . Up until NAND flash, disk based IO sub systems have not kept pace with CPU advancements. With next generation storage ( resistance ram etc) CPUs and storage may follow the same curve.
How Execution Plans Run Control flow Row by row Row by row Row by row Row by row How do rows travel between Iterators ? Data Flow
What Is Required Query execution which leverages CPU caches. Break through levels of compression to bridge the performance gap between IO subsystems and modern processors. Better query execution scalability as the degree of parallelism increase.
Optimizer Batch Mode First introduced in SQL Server 2012, greatly enhanced in 2014 A batch is roughly 1000 rows in size and it is designed to fit into the L2/3 cache of the CPU, remember the slide on latency. Moving batches around is very efficient*: One test showed that regular row-mode hash join consumed about 600 instructions per row while the batch-mode hash join needed about 85 instructions per row and in the best case (small, dense join domain) was a low as 16 instructions per row. * From: Enhancements To SQL Server Column Stores Microsoft Research
Stack Walking The Database Engine xperf on base stackwalk profile SELECT p.EnglishProductName ,SUM([OrderQuantity]) ,SUM([UnitPrice]) ,SUM([ExtendedAmount]) ,SUM([UnitPriceDiscountPct]) ,SUM([DiscountAmount]) ,SUM([ProductStandardCost]) ,SUM([TotalProductCost]) ,SUM([SalesAmount]) ,SUM([TaxAmt]) ,SUM([Freight]) FROM [dbo].[FactInternetSales] f JOIN [dbo].[DimProduct] p ON f.ProductKey = p.ProductKey GOUP BY p.EnglishProductName xperfview stackwalk.etl xperf d stackwalk.etl
How do we squeeze an entire column store index into a CPU L2/3 cache ? Answer Its pipelined into the CPU
. . and whats happening in the call stack Conceptual View . . . CPU Break blobs into batches and pipeline them into CPU cache Load segments into blob cache Lob cache
What Difference Does Batch Mode Make ? SELECT p.EnglishProductName ,SUM([OrderQuantity]) ,SUM([UnitPrice]) ,SUM([ExtendedAmount]) ,SUM([UnitPriceDiscountPct]) ,SUM([DiscountAmount]) ,SUM([ProductStandardCost]) ,SUM([TotalProductCost]) ,SUM([SalesAmount]) ,SUM([TaxAmt]) ,SUM([Freight]) FROM [dbo].[FactInternetSalesBig] f JOIN [dbo].[DimProduct] p ON f.ProductKey = p.ProductKey GROUP BY p.EnglishProductName at x12 Batch DOP 2 Row mode Batch Row mode 0 100 200 300 400 500
What Are The Pre-Requisites For Batch Mode ? SQL Server 2014 Feature SQL Server 2012 Presence of column store indexes Yes Yes Parallel execution plan Yes Yes No outer joins, NOT Ins or UNION ALLs Yes No Hash joins do not spill from memory Yes No Scalar aggregates cannot be used Yes No
Row mode Hash Match Aggregate 445,585 ms* Vs. Batch mode Hash Match Aggregate 78,400 ms* * Timings are a statistical estimate
Optimizing Serial Scan Performance Dictionary Compressing data going down the column is far superior to compressing data going across the row, also we only retrieve the column data that is of interest. Run length compression is used in order to achieve this. SQL Server 2012 introduces column store compression . . ., SQL Server 2014 adds more features to this. Lookup ID 1 Label Red 2 Blue Colour 3 Green Red Red Segment Lookup ID 1 Run Length 2 Blue Blue 2 2 Green 3 3 Green Green
SQL Server 2014 Column Store Storage Internals Row Groups < 102,400 rows A B C Encode & Compress Store Delta stores Encode and Compress Blobs Segments Columns
Column Store Index Split Personality Global dictionary Deletion Bitmap Local Dictionary Inserts of 102,400 rows and over Inserts less than 102,400 rows and updates update = insert into delta store + insert to the deletion bit map Tuple mover Column store segments Delta store B-tree
What Levels Of Compression Are Achievable ? Our Big FactInternetSales Table SELECT [ProductKey] ,[OrderDateKey] ,[DueDateKey] ,[ShipDateKey] ,[CustomerKey] ,[PromotionKey] ,[CurrencyKey] . . INTO FactInternetSalesBig FROM [dbo].[FactInternetSales] CROSS JOIN master..spt_values AS a CROSS JOIN master..spt_values AS b WHERE a.type = 'p' AND b.type = 'p' AND a.number <= 80 AND b.number <= 100 80,000 Size (Mb) 70,000 60,000 57 % 74 % 94 % 92 % 50,000 40,000 30,000 20,000 10,000 494,116,038 rows 0 Heap Row compression Page compression Clustered column store index Column store archive compression
What Levels Of Compression Are Achievable ? Stack Exchange Posts* Table 350 300 250 72 % 53 % 59 % 64 % 200 150 100 50 0 Heap Row Compression Page compression Clustered column store index Clustered column store index archive compression * Posts tables from the four largest stack exchanges combined ( superuser, serverfault, maths and Ubuntu )
SQL Server 2012 / 2014 Column Store Comparison SQL Server 2014 Feature SQL Server 2012 Column store indexes Yes Yes Clustered column store indexes No Yes Updateable column store indexes No Yes Column store archive compression No Yes Columns in a column store index can be dropped No Yes Support for GUID, binary, datetimeoffset precision > 2, numeric precision > 18. No Yes Enhanced compression by storing short strings natively ( instead of 32 bit IDs ) No Yes Bookmark support ( row_group_id:tuple_id) No Yes Mixed row / batch mode execution No Yes Optimized hash build and join in a single iterator No Yes Hash memory spills cause row mode execution No Yes Iterators supported Scan, filter, project, hash (inner) join and (local) hash aggregate Yes
Column Store Index and Batch Mode Test Drive Disclaimer: your own mileage may vary depending on your data, hardware and queries
Test Set Up Hardware 2 x 2.0 Ghz 6 core Xeon CPUs Hyper threading enabled 22 GB memory Raid 0: 6 x 250 GB SATA III HD 10K RPM Raid 0: 3 x 80 GB Fusion IO Software Windows server 2012 SQL Server 2014 CTP 2 AdventureWorksDW DimProductTable Enlarged FactInternetSales table
Sequential Scan Performance Compression Type / Time (ms) 300000 Time (ms) 250000 SELECT SUM([OrderQuantity]) ,SUM([UnitPrice]) ,SUM([ExtendedAmount]) ,SUM([UnitPriceDiscountPct]) ,SUM([DiscountAmount]) ,SUM([ProductStandardCost]) ,SUM([TotalProductCost]) ,SUM([SalesAmount]) ,SUM([TaxAmt]) ,SUM([Freight]) FROM [dbo].[FactInternetSalesBig] 200000 150000 100000 2050Mb/s 678Mb/s 256Mb/s 85% CPU 98% CPU 98% CPU 50000 0 No compression Row Page No compression Row Page compression compression compression compression
No compression 545,761 ms* Vs. Page compression 1,340,097 ms* All stack trace timings are a statistical estimate
Elapsed Time(ms) / Column Store Compression Type 4500 Elapsed Time(ms)/Compression Type 4000 3500 3000 2500 52 Mb/s 27 Mb/s 99% CPU 56% CPU 2000 1500 1000 500 0 hdd cstore hdd cstore archive flash cstore flash cstore archive
Clustered column store index 60,651 ms Vs. Clustered column store index with archive compression 61,196 ms
Takeaways What most people tend to have CPU CPU used for IO consumption + CPU used for decompression < total CPU capacity Compression works for you
Takeaways CPU CPU used for IO consumption + CPU used for decompression > total CPU capacity Compression works against you CPU used for IO consumption + CPU used for decompression = total CPU capacity Nothing to be gained or lost from using compression
Testing Join Scalability We will look at the best we can do without column store indexes: Partitioned heap fact table with page compression for spinning disk Partitioned heap fact table without any compression our flash storage Non partitioned column store indexes on both types of store with and without archive compression. SELECT p.EnglishProductName ,SUM([OrderQuantity]) ,SUM([UnitPrice]) ,SUM([ExtendedAmount]) ,SUM([UnitPriceDiscountPct]) ,SUM([DiscountAmount]) ,SUM([ProductStandardCost]) ,SUM([TotalProductCost]) ,SUM([SalesAmount]) ,SUM([TaxAmt]) ,SUM([Freight]) FROM [dbo].[FactInternetSalesBig] f JOIN [dbo].[DimProduct] p ON f.ProductKey = p.ProductKey GROUP BY p.EnglishProductName
Join Scalability DOP / Time (ms) Time (ms) 800000 HDD page compressed partitioned fact table 700000 Flash partitioned fact table 600000 500000 400000 300000 200000 100000 0 2 4 6 8 10 Degree of parallelism 12 14 16 18 20 22 24
Join Scalability DOP / Time (ms) Time (ms) 60000 hdd column store hdd column store archive 50000 flash column store flash column store archive 40000 30000 20000 10000 0 2 4 6 8 10 12 14 16 18 20 22 24 Degree of parallelism
Takeaways A simple join between a dimension and fact table using batch mode is an order of magnitude faster than the row mode equivalent. For flash, the cost of decompressing the column store is more than offset by: CPU cycle savings made by moving rows around in batches. CPU cycles savings made through the reduction of cache misses.
Diving Deeper into Batch Mode Scalability
Average CPU Utilisation and Elapsed Time (ms) / Degree of Parallelism 40000 120 Elapsed Time (ms) Pct CPU Utilisation 35000 100 30000 80 25000 20000 60 15000 40 10000 20 5000 0 0 1 2 4 6 8 10 12 14 16 18 2 3 4 5 6 7 8 9 10 20 22 24 11 12
Wait and Spinlock Analysis At 100 CPU Utilisation Wait ------------------------- -------- ----------- -------- ------ ------------------- HTBUILD 0.490000 0.477000 SOS_SCHEDULER_YIELD 0.245000 0.050000 QUERY_TASK_ENQUEUE_MUTEX 0.079000 0.053000 LATCH_EX 0.036000 0.034000 HTDELETE 0.024000 0.011000 Wait_S Resource_S Signal_S Waits Percentage 0.013000 0.195000 0.026000 0.002000 0.013000 138 46131 27.6523702031602702 23 8.9164785553047403 89 4.0632054176072234 138 2.7088036117381485 55.3047404063205411 Total spinlock spins = 554397 Hypothesis: could main memory not being able to keep up ?
0.7 CPI / DOP 0.6 0.5 0.4 0.3 Going past one memory channel per physical core 0.2 0.1 0 1 2 4 6 8 10 12 14 16 18 20 2 3 4 5 6 7 8 9 10 11 22 24 12
Takeaway Memory bandwidth Function of: Memory channels Number of DIMMS DIMM speed = Total CPU core consumption capacity
Further Reading Enhancements To Column Store Indexes (SQL Server 2014 ) Microsoft Research SQL Server Clustered Columnstore Tuple Mover Remus Rasanu SQL Server Columnstore Indexes at Teched 2013 Remus Rasanu The Effect of CPU Caches and Memory Access Patterns Thomas Kejser
Thanks To My Reviewer and Contributor Thomas Kejser Former SQL CAT member and CTO of Livedrive
Contact Details ChrisAdkin8 chris1adkin@yahoo.co.uk http://uk.linkedin.com/in/wollatondba


 / Column Store Compression Type")


")
")


 /")