Commonly Used Loop Structures in R Programming
Discover the commonly used loop structures in R programming, including 'for,' 'while,' 'apply,' 'repeat,' along with important keywords such as 'break,' 'next,' 'stop.' Learn syntax examples and best practices for efficient programming.

Download Presentation

Please find below an Image/Link to download the presentation.
The content on the website is provided AS IS for your information and personal use only. It may not be sold, licensed, or shared on other websites without obtaining consent from the author. If you encounter any issues during the download, it is possible that the publisher has removed the file from their server.
You are allowed to download the files provided on this website for personal or commercial use, subject to the condition that they are used lawfully. All files are the property of their respective owners.
The content on the website is provided AS IS for your information and personal use only. It may not be sold, licensed, or shared on other websites without obtaining consent from the author.
E N D
Presentation Transcript
Arko Barman COSC 6335 Data Mining University of Houston
Commonly used loop structures in R - for while apply repeat Other important keywords break next (similar to continue in C/C++) stop
Syntax: for(variable in sequence) { statements } Example 1: mydf <- iris myve <- NULL # Creates empty storage container for(i in seq(along=mydf[,1])) { myve <- c(myve, mean(as.numeric(mydf[i, 1:3]))) } myve Example 1:
Example 2: x <- 1:10 z <- NULL for(i in seq(along=x)) { if (x[i]<5) { z <- c(z,x[i]-1) } else { stop("values need to be <5") } } z Example 2: Note the error message produced by stop. We can also use break.
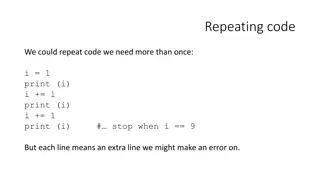
Syntax: while(condition) statements Example 1: z <- 0 while(z < 5) { z <- z + 2 print(z) } z Example 1:
Example 2: z <- 0 while(z >= 0) { if(z >= 5) { break } z <- z + 2 print(z) } z Example 2: Note break statement Beware of infinite loops!
Syntax: apply(X, MARGIN, FUN, ARGs) X array, matrix or data.frame MARGIN 1 for rows, 2 for columns, c(1,2) for both FUN one or more functions ARGs possible arguments for functions Example 1: ## Example for applying predefined mean function apply(iris[,1:3], 1, mean) Example 1:
Example 2: x <- 1:10 test <- function(x) { # Defines some custom function if(x < 5) { x-1 } else { x / x } } apply(as.matrix(x), 1, test) Example 2: Example 3: x <- 1:10 apply(as.matrix(x), 1, function(x) { if (x<5) { x-1 } else { x/x } }) Example 3:
Syntax: repeat { statements break or stop with condition } Example: z <- 0 repeat { z <- z + 1 print(z) if(z > 100) break() } Remember to insert loop terminating condition!
Syntax to define functions: myfct <- function(arg1, arg2, ...) { function_body } Syntax to define functions: Syntax to call functions: myfct(arg1=..., arg2=...) Syntax to call functions:
Things to remember: Assignment is done with keyword function Avoid using names of existing functions Useful to provide default values for arguments Example 1: myfct <- function(x1, x2=5) { z1 <- x1/x1 z2 <- x2*x2 myvec <- c(z1, z2) return(myvec) }
Example 1 (continued): Find out the output for each! myfct myfct(x1=2, x2=5) myfct(2, 5) myfct(x1=2)
Control utilities in functions: return terminates a function stop stops execution of function and prints message warning prints warning message in unexpected situations error Example: myfct <- function(x1) { if (x1>=0) print(x1) else stop("This function did not finish, because x1 < 0") warning("Value needs to be > 0") } myfct(x1=2) myfct(x1=-2)
Consider a purity function described below: purity(a,b,outliers=FALSE) computes the purity of a clustering result based on an apriori given set of class labels, where a gives the assignment of objects in a dataset O to clusters, and b is the ground truth Mathematically, Let O be a dataset and X={C1, ,Ck} be a clustering of O with Ci O (for i=1, ,k), C1 Ck O and Ci Cj= (for i j) purity(X)= (number_of_majority_class_examples(X)/(total_number_examples_in_clusters(X)) If the used clustering algorithm supports outliers, outliers should be ignored in purity computations if parameter outliers=TRUE the function returns a vector: (<purity>,<percentage_of_outliers); e.g. if the function returns (0.98, 0.2) this would indicate that the purity is 98%, but 20% of the objects in dataset O have been classified as outliers
purity<-function(a,b,outliers=FALSE) { require('matrixStats'); t<-table(a,b); rowTotals<-rowSums(t); #the same can be done with apply(t,1,sum) rowMax<-apply(t,1,max); if(!outliers) { purity<-sum(rowMax)/sum(rowTotals); return (purity) } else { if(NROW(rowTotals)>1) { purity<-(sum(rowMax)-rowMax[1])/(sum(rowTotals)-rowTotals[1]); } else { purity<-NA; } pcOutliers=rowTotals[1]/(sum(rowTotals)); returnVector=vector(mode='double',length=2); returnVector[1]=purity; returnVector[2]=pcOutliers; return(returnVector); } }
Download Complex8 dataset from TA webpage>Resources Copy the purity function Example code: setwd(<path>) complex8<-data.frame(read.csv('complex8.data',header=FALSE)) require('cluster') require('matrixStats') require('fpc') require('ggplot2')
Example code(continued): nClusters=8 set.seed(1754) complex8KMeans<-kmeans(complex8[1:2],nClusters) plotFrame<- data.frame(a=complex8[,1],b=complex8[,2],z=factor(complex8KMeans$cluster)) ggplot(plotFrame, aes(x=a, y=b, colour=z))+ geom_point()+scale_fill_brewer(palette="Spectral") complex8KMeans t<-table(complex8KMeans$cluster,complex8[,3]) pur<-purity(complex8KMeans$cluster,complex8[,3],outliers=FALSE) pur


:")


 {")

:")