Community Integration Project Progress Report March 2015
Learn about the latest updates on the Training Center Community Integration Project, including census reduction, corrected data for community living, readmissions statistics, NVTC progress, provider development, bridge funding, and exceptional supports rate applications.

Download Presentation

Please find below an Image/Link to download the presentation.
The content on the website is provided AS IS for your information and personal use only. It may not be sold, licensed, or shared on other websites without obtaining consent from the author. If you encounter any issues during the download, it is possible that the publisher has removed the file from their server.
You are allowed to download the files provided on this website for personal or commercial use, subject to the condition that they are used lawfully. All files are the property of their respective owners.
The content on the website is provided AS IS for your information and personal use only. It may not be sold, licensed, or shared on other websites without obtaining consent from the author.
E N D
Presentation Transcript
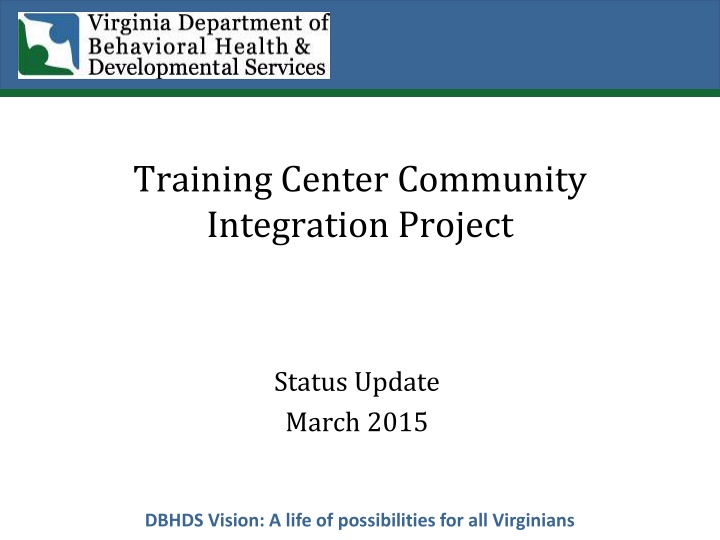
Training Center Community Integration Project Status Update March 2015 DBHDS Vision: A life of possibilities for all Virginians
Census Reduction October 2011 to March 2015 52% census reduction since June 2011 Current Census is 529 Census will be < 500 by April 2015 Slide 2
Corrected Data for Community Living 216 have moved to a home with 4 or less beds 142 have moved to a home with 5 or more beds 61 have moved to Community ICF/IID s 21 have moved to Nursing Facilities Slide 3
Readmissions Only 1.5% of individuals who have moved from a Training Center have returned and continue to look for options to meet their support needs. Cumulative Readmission Rate as of Feb. 24, 2015 1.5% 1.5% 1.0% 1.0% 1.0% 0.5% 0.0% 0.0% FY12 FY13 FY14 FY15 Year Slide 4
NVTC The NVTC Census is 74 from 147 in October 2011. 49% of the individuals with Profound Intellectual Disability have already discharged to community homes. Options for individual and Authorized Representative choice have been identified for 71 of the 74 residents. The census will reach less than 50 by July, 2015 and 0 no later than March 2016. Slide 5
Provider Development Region II Providers existing, expanding or in development : There are a total of 17 Providers with openings that are currently available or in development 16 existing homes with 50 openings currently available 8 homes in development with 59 openings to be ready no later than June 2015 109 total openings/options for families to choose from by June 2015 Slide 6
Bridge Funding The NVTC Bridge Funding budget is $2.75M The SVTC Bridge Funding budget is $1.5M As of February 25th 2015 Total bridge funding encumbered $2,106,080 As of January 2015 funds in process for payment NVTC $289K SVTC $618K Slide 7
Exceptional Supports Rate DBHDS has received 23 Exceptional Supports Rate Applications 21 Applications have been reviewed 15 Applications have been approved Slide 8
Success Stories Questions Slide 9