Comparative Analysis of Index Insurance and Cash Transfers in Northern Kenya
This study compares the impacts of index insurance coverage and cash transfer programs on the production strategies and welfare of pastoralists in Marsabit, Kenya. It explores behavioral changes in response to risk profiles and financial assistance, focusing on livestock-dependent communities facing drought challenges. The research evaluates the effectiveness of index-based livestock insurance in providing social protection and reducing poverty within the pastoralist context.

Download Presentation

Please find below an Image/Link to download the presentation.
The content on the website is provided AS IS for your information and personal use only. It may not be sold, licensed, or shared on other websites without obtaining consent from the author.If you encounter any issues during the download, it is possible that the publisher has removed the file from their server.
You are allowed to download the files provided on this website for personal or commercial use, subject to the condition that they are used lawfully. All files are the property of their respective owners.
The content on the website is provided AS IS for your information and personal use only. It may not be sold, licensed, or shared on other websites without obtaining consent from the author.
E N D
Presentation Transcript
Index Insurance and Cash Transfers: Index Insurance and Cash Transfers: A Comparative Analysis from Northern Kenya A Comparative Analysis from Northern Kenya Nathaniel D. Jensen, Andrew G. Mude and Christopher B. Barrett Presented by Nathan Jensen Minneapolis, MN July, 2014
Motivation Both cash transfers and index insurance are often endorsed as effective tools for reducing poverty and providing social protection. Cash transfers have been extensively studied while the rapid proliferation of index insurance programs in developing countries has progressed without a parallel growth in knowledge of the quantity or impacts of such programs. In one of the most extensive synthesis written about the impacts if index insurance, Cole et al. (2012) conclude the following: The field is in urgent need of evaluations analysing take-up and impact of marketed products at this stage, research on the impact of index-based insurance should be the key priority. It cannot be emphasised enough that very few empirical evaluations of marketed index-based micro-insurance programmes exist (Cole et al. 2012, p. 46-47). 2 NATHANIEL JENSEN JULY 2014 | CORNELL UNIVERSITY
What impact does index insurance coverage have on the production strategies and welfare of pastoralists? How do those outcomes compare to that of an unconditional cash transfer program? Behavioral changes to investment & production strategies in response to changes in risk profile and base income Cash Transfers: Bianchi & Bobba 2013; Covarrubias et al. 2012; Gertler et al. 2012; Stoeffler & Mills 2014 Index Insurance: Cai et al. 2010; Karlan et al. 2014; Mobarak & Rosenzweig 2012 Welfare impacts of behavioral changes and direct financial transactions Cash Transfers: An abundance of encouraging although not necessarily consistent studies. See Arnold (2011) and Fiszbein & Schady (2009) for surveys of the literature Index Insurance: Karlan et al. 2014; Janzen & Carter 2013 NATHANIEL JENSEN JULY 2014 | CORNELL UNIVERSITY 3
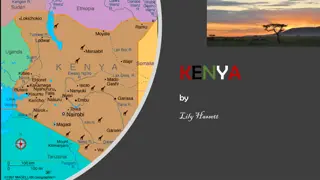
Setting: Pastoralists in Marsabit, Kenya Pastoralists generate a large portion of their income from livestock and livestock byproducts. (43% of our observations are 100% livestock dependent) Drought is the largest killer of livestock. Causes of Livestock Mortality Marsabit, Kenya Droughts periodically decimate herds. Source: Author s calculation (2009-2012) NATHANIEL JENSEN JULY 2014 | CORNELL UNIVERSITY 4
Index Based Livestock Insurance (IBLI) Introduced in northern Kenya, January 2010 Objective: To insure households against livestock mortality associated with droughts Signal: Remotely sensed normalized differenced vegetation index (NDVI) as an indicator of forage availability Index: Predicts division average seasonal livestock mortality rate Privately provided with public support (DFID, GoK, ILRI, USAID, WB) Source: Esri See http://livestockinsurance.wordpress.com/, Chantarat et al. (2013) for details 1 year contract coverage 1 year contract coverage LRLD season coverage LRLD season coverage SRSD season coverage SRSD season coverage Jan Feb Mar Apr May Jun Jul Aug Sep Oct Nov Dec Jan Feb Jan Feb Mar Apr May Jun Jul Aug Sep Oct Nov Dec Jan Feb Sale period Sale period For LRLD For LRLD Period of NDVI observations for constructing LRLD mortality index constructing LRLD mortality index Period of NDVI observations for Period of NDVI observations For constructing SRSD Period of NDVI observations For constructing SRSD mortality index mortality index Sale period For SRSD For SRSD Sale period Predicted LRLD mortality is announced. Indemnity payment is made if IBLI is triggered Indemnity payment is made if IBLI is triggered Predicted LRLD mortality is announced. Predicted SRSD mortality is announced. Predicted SRSD mortality is announced. Indemnity payment is made if IBLI is triggered Indemnity payment is made if IBLI is triggered For more information on the IBLI project, visit http://livestockinsurance.wordpress.com/ NATHANIEL JENSEN 5 JUNLY 2014 | CORNELL UNIVERSITY
Hunger Safety Net Program (HSNP) Part of the larger GoK National Safety Net Program Phase I: 2009-2013 (funded by DFID) Unconditional bi-monthly cash transfers (~$28/transfer1) 3 targeting strategies randomized at the community level: 1. Social pension: All members over the age of 54 2. Depends ratio: Ratio of members that are dependent > 57% 3. Community based targeting: 50% of the community, selected by the community No retargeting or graduation See http://www.hsnp.or.ke/, Hurrell & Sabates-Wheeler (2013) for details. 1 $ indicates USD, which is calculated using exchanges rates from 1/1/2010. As a reference point, the average monthly income in our data is $51.57. NATHANIEL JENSEN 6 JUNLY 2014 | CORNELL UNIVERSITY
Research Design & Data Legend MarsabitIBLI HSNP, IBLI Game_HSNP, No IBLI Game_No HSNP, IBLI Game_No HSNP, N Survey data Annual longitudinal survey of 924 households for 4 rounds 4/5 IBLI index divisions Seasonal data collected for the most relevant variables HSNP, IBLI Game HSNP, No IBLI Game No HSNP, IBLI Game SABARET ILLERET No HSNP, No IBLI Game DUKANA EL-HADI FUROLE DARADE BALESA NORTH HORR HURRI HILLS MOITE EL GADE GALAS KALACHA MAIKONA GAS LOIYANGALANI TURBI ARAPAL LARACHI KURUGUM Research Design Overlap with a cash transfer program (HSNP) in 8 of 16 communities Randomized distribution of coupons providing from 10-60% discount on IBLI policies to 60% of sample each sales window OLTUROT BUBISA MT. KULAL MAJENGO(MARSABIT) QILTA KARGI JIRIME HULAHULA OGUCHO KITURUNI SAGANTE KURUNGU DIRIB GOMBO SONGA JALDESA KARARE SHURA HAFARE SOUTH HORR(MARSA) KAMBOYE KORR ILLAUT(MARSABIT) GUDAS/SORIADI LOGOLOGO LONYORIPICHAU NGURUNIT LAISAMIS LONTOLIO KOYA MERILLE IRIR 7 NATHANIEL JENSEN JUNLY 2014 | CORNELL UNIVERSITY
Econometric Strategy ?2+ ??+ ??? ???= ?0+ ?1?????+ ??? ?????= {(???????,??????),(???????,??????)} (HSNPC??,HSNP??) = (Cumulative prior seasons as an HSNP participant, Current HSNP participant) (IBLIC??,IBLI??) =(Cumulative prior seasons with IBLI coverage, Current IBLI coverage in TLUs) Unobserved ?? Use household fixed effect model Assume unobserved x?? that are correlated with ????? & ??? Instrument for ????? a. IBLI: Randomly distributed discount coupons b. HSNP: Exogenous eligibility thresholds NATHANIEL JENSEN 8 JUNLY 2014 | CORNELL UNIVERSITY
HSNP (FE-IV) IBLI (FE-IV) Previous Participation Current Participant Previous Coverage Current Coverage (TLU) Production strategies: Herd Size -0.167 (0.453) 11.06 (59.95) 0.0126 (0.0185) 0.0322 (0.0206) -3.216 (4.121) 371.3 (316.4) 0.106 (0.0965) 0.185** (0.0855) -5.912** (2.776) 955.3** (462.2) 0.169 (0.165) -0.0871 (0.147) 0.139 (0.662) 5.039 (167.5) -0.118* (0.0711) 0.0934 (0.0658) Veterinary Expenditures (KSH) Ratio of Herd Held at Home Household is Partially/Fully MobileA Production outcomes: Milk income per TLU (KSH) 74.08** (30.47) -0.0260** (0.0115) -103.1 (127.8) 0.0556 (0.0348) 760.8*** (211.1) -0.00838 (0.0599) 118.8** (57.25) -0.00280 (0.0161) Livestock Mortality Rate A complete list of covariates, coefficient estimates, and model statistics can be found in Jensen, Mude & Barrett (2014). A A linear probability model is used to estimate the likelihood that a household is partially or fully mobile. Clustered and robust standard errors in parentheses. *** p<0.01, ** p<0.05, * p<0.1. NATHANIEL JENSEN 9 JUNLY 2014 | CORNELL UNIVERSITY
The impact of covariate shocks and program participation on livestock sales (TLUs) Current HSNP Participant (FE-IV) 0.261*** (0.087) 0.215 (0.166) 0.0163 (0.203) Current IBLI Coverage (FE-IV) 0.362*** (0.082) 0.188** (0.083) -0.215 (0.158) Shock Participation/Coverage (P/C) P/C*Shock H0: P/C + P/C *Shock=0 (t-statistic) Observations Model F-statistic 1.118 6,564 4.993 -0.200 6,570 5.054 The shock is an indicator that the division average livestock mortality rates in the current season are equal to or above 15%. A complete list of covariates, coefficient estimates, and model statistics can be found in Jensen, Mude & Barrett (2014). Clustered robust standard errors in parentheses. *** p<0.01, ** p<0.05, * p<0.1. NATHANIEL JENSEN 10 JUNLY 2014 | CORNELL UNIVERSITY
HSNP (FE-IV) IBLI (FE-IV) Previous Participation Current Participant Previous Coverage Current Coverage (TLU) Indicators of Welfare: Consumption per Adult Equivalent (AE) -60.36* (34.01) -32.17 (372.9) [15.67] 355.7 (150.7) -180.7 (150.7) [13.03] Asset Index -8.715*** (3.031) 16.98* (8.765) [18.26] -16.13 (23.26) -6.077 (4.697) [21.04] Income per AE 0.595 (41.35) 374.5 (293.5) [17.99] 132.9 (304.1) 420.7*** (150.2) [19.13] School Enrollment 0.0242 (0.0244) -0.0392 (0.0941) [4.077] 0.0931 (0.115) 0.0629 (0.0501) [3.785] MUAC 0.0729 (0.109) 0.539 (0.651) [7.086] -0.417 (0.846) -0.0185 (0.226) [6.504] A complete list of covariates, coefficient estimates, and model statistics can be found in Jensen, Mude & Barrett (2014). Clustered robust standard errors in parentheses. Model F-statistic in brackets. *** p<0.01, ** p<0.05, * p<0.1. NATHANIEL JENSEN 11 JUNLY 2014 | CORNELL UNIVERSITY
Impacts Normalized by Cost Among Clients Income from Milk Impact 1,585 2,536 Income per AE Impact 336 361 Cost structure Total Program Cost/Participant: Impact/Cost 0.0333 0.0587 Impact/Cost 0.0071 0.0084 HSNP IBLI Marginal Cost of an Additional Participant: All values in real 2009 Kenya Shillings. Impacts are estimated using the average client value and costs provided below, and parameter estimates in the previous two slides. HSNP IBLI 1,585 2,536 0.0469 1.1660 336 361 0.0099 0.1662 Average values in the final survey round (clients) Average cumulative cost per client by the final round (KSH) VOI HSNP HSNPC IBLI IBLIC Values are calculated for the subset of clients in each program. Mean VOI in Final Period 0.89 3.89 0.48 1.20 HSNP 47,600 IBLI 43,200 Total Program Cost/Participant (2.7BN/57,811HH) (99MM/3,297contracts*1.4 4 contract/HH) 2,175 (4.41TLUs) Marginal Cost of an Additional Participant 33,800 (14.6 transfers) NATHANIEL JENSEN 12 JUNLY 2014 | CORNELL UNIVERSITY
Impacts Normalized by Cost Among Clients Income from Milk Impact 1,585 2,536 Income per AE Impact 336 361 Cost structure Total Program Cost/Participant: Impact/Cost 0.0333 0.0587 Impact/Cost 0.0071 0.0084 HSNP IBLI Marginal Cost of an Additional Participant: All values in real 2009 Kenya Shillings. Impacts are estimated using the average client value and costs provided below, and parameter estimates in the previous two slides. HSNP IBLI 1,585 2,536 0.0469 1.1660 336 361 0.0099 0.1662 Average values in the final survey round (clients) Average cumulative cost per client by the final round (KSH) VOI HSNP HSNPC IBLI IBLIC Values are calculated for the subset of clients in each program. Mean VOI in Final Period 0.89 3.89 0.48 1.20 HSNP 47,600 IBLI 43,200 Total Program Cost/Participant (2.7BN/57,811HH) (99MM/3,297contracts*1.4 4 contract/HH) 2,175 (4.41TLUs) Marginal Cost of an Additional Participant 33,800 (14.6 transfers) NATHANIEL JENSEN 13 JUNLY 2014 | CORNELL UNIVERSITY
Conclusions Households with IBLI coverage reduce herd size (precautionary savings), are more active in livestock markets during non-shock seasons, increase investments in livestock health services and realize greater productivity. HSNP participants are more mobile, experience reduced livestock mortality and increased productivity. Both programs are likely to improve income/AE. HSNP & IBLI produce similar improvements/TPC/participant. IBLI generates greater improvements/MC/participant. NATHANIEL JENSEN 14 JUNLY 2014 | CORNELL UNIVERSITY
IBLI IVs A test of balance between coupon recipients and non-recipients finds few significant differences (<10% of the characteristics observed). Receiving a coupon has a positive and significant impact on demand. Dummy Level (=1 if purchased) 0.206*** (0.028) (TLUs insured) 0.541*** (0.076) Coupon Dummy Observations F(2,1008) R2 Regression includes the following covariates: adult equivalence, age of head, age of head squared, maximum education in household, a dummy indicating the head of household is a widow, the current season s predicted livestock mortality rate, the current season s predicted livestock mortality rate squared, division-period dummies and the three HSNP targeting characteristics to the first, second, and third power. Clustered and robust standard errors in parentheses. *** p<0.01, ** p<0.05, * p<0.1 7,042 33.5 0.225 7,042 32.7 0.128 NATHANIEL JENSEN 15 JUNLY 2014 | CORNELL UNIVERSITY
HSNP IVs Tests for distortions in the responses around the thresholds does not reveal misreporting to meet eligibility requirements. The intent to treat indicator has a positive and significant impact on the likelihood of participating in HSNP. HSNP Participant 0.614*** (0.050) ITT Observations Pseudo R2 Regression includes the following covariates: adult equivalence, age of head, age of head squared, maximum education in household, a dummy indicating the head of household is a widow, the current season s predicted livestock mortality rate, the current season s predicted livestock mortality rate squared, division-period dummies and the three HSNP targeting characteristics to the first, second, and third power. Clustered and robust standard errors in parentheses. *** p<0.01, ** p<0.05, * p<0.1 7,036 0.524 NATHANIEL JENSEN 16 JUNLY 2014 | CORNELL UNIVERSITY


")
")


")

")