Comparative Genomic Analysis of Desert Ensifer Strains Revealed through Electrophoresis and Copy Number Quantification
Explore the genetic characteristics of newly sequenced desert Ensifer strains through gel electrophoresis, copy number quantification, and pairwise genome comparisons. Discover core and accessory genome proportions, sizes, and GC percentages in different Ensifer species.

Uploaded on | 0 Views
Download Presentation

Please find below an Image/Link to download the presentation.
The content on the website is provided AS IS for your information and personal use only. It may not be sold, licensed, or shared on other websites without obtaining consent from the author. If you encounter any issues during the download, it is possible that the publisher has removed the file from their server.
You are allowed to download the files provided on this website for personal or commercial use, subject to the condition that they are used lawfully. All files are the property of their respective owners.
The content on the website is provided AS IS for your information and personal use only. It may not be sold, licensed, or shared on other websites without obtaining consent from the author.
E N D
Presentation Transcript
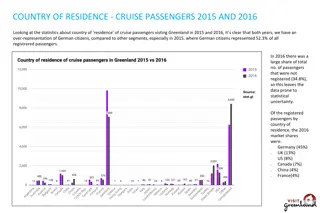
Figure S1. Eckhard gel electrophoresis of newly sequenced desert Ensifer strains . Reference strains used were Agrobacterium fabrum C58 (C58), A. vitis S4 (S4), E. meliloti 1021 (Sm1021) and Rhizobium etli CFN42 (CFN42). The known replicon sizes (in Kbp) are indicated next to the bands on the figure using the color code of the corresponding strains (indicated at the bottom of each lane). Stars indicate the presence of repliconsin the studied desert isolates. 1683 2000 - -1354 1283 - 631 - 642 505 371 250 194 184 542 - 258 - 211 - 214 - 130 - 78 - LMR001 LMR013 LEM451 LEM457 Sm 1021 CFN 42 TP6 C58 S4
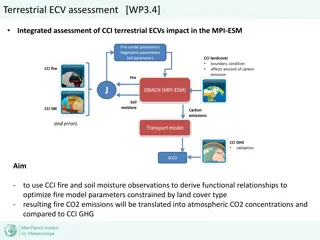
Figure S2. Quantification of the copy number of chromosomal and symbiotic markers from gDNA extracts of strains LEM451 and LEM457 cultivated in different media. The mean copy number of replicates of chromosomal markers (recA and glnII) or symbiotic markers (nodC and nodF) obtained from genomic DNA extracts upon culturing clones in YEM medium, RMS medium or RMS complemented with the flavonoidsGenistein (G) or Naringenin (N) were estimated using a serial dilution of gDNA quantified by Pico Green reagent. The gDNA extracts recovered from clones of LEM457 did not show any amplification demonstrating the absence of the symbiotic markers in these gDNA extracts. 35000 housekeeping markers symbiotic markers 30000 Copy number estimate 25000 20000 15000 10000 5000 0 YEM RMS RMS + G RMS + N YEM RMS RMS + G RMS + N LEM451 LEM457
Figure S3. Horizontal Box plots showing 1000 bp fragments % identity distributions obtained upon pairwise comparisons (indicated as insets for each box plot) TP6 Vs TW10 LMR001 Vs LMR013 LEM451 Vs LEM457 LMR001 Vs LEM451 LEM451 Vs LMR013 TP6 Vs LMR013 LEM457 Vs LMR013 LMR001 Vs LEM457 TW10 Vs LMR013 LEM451 Vs TP6 LMR001 Vs TP6 TP6 Vs LEM457 LMR001 Vs TW10 LEM451 Vs TW10 TW10 Vs LEM457
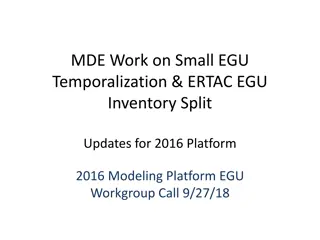
E. aridii A E. meliloti E. medicae E. fredii Figure S4. Comparison of core and accessory genome proportions (A), size (B) and GC percentage (C) in Ensifer aridi, E. meliloti, E. medicae and E. fredii as estimated using the Spine pipeline (See Methods section). 100% 100% 100% 100% 90% 90% 90% 90% Proportion of core and accessory 80% 80% 80% 80% 70% 70% 70% 70% genomes (%) 60% 60% 60% 60% 50% 50% 50% 50% 40% 40% 40% 40% 30% 30% 30% 30% 20% 20% 20% 20% 10% 10% 10% 10% 0% 0% 0% 0% B Core Accessory Core Accessory core accessory core Accessory 7.E+06 accessory genomes 6.E+06 Size of core and 5.E+06 (bp) 4.E+06 core 3.E+06 Accessory 2.E+06 1.E+06 0.E+00 E aridii E. meliloti E. medicae E. fredii C 70 68 66 64 62 GC (%) %GC in core genome 60 %GC in accessory genome 58 56 54 52 50 E aridii E. meliloti E. medicae E. fredii
Figure S5. Pangenomes of 4 Ensifer species based on 6 genomic sequences per species. E. aridi (A), E. meliloti (B), E. medicae (C) and E. fredii pangenomesare shown as horizontal grey bars. For each strain (colored on the right), translated sequences showing more than 80% identity on 80% of alignment length to genomic objects identified in the pangenomes (light purple bar under the grey bar) obtained upon pangenome analysis are represented as vertical bars using the same color code as strain name. The black and purple line plots are showing GC content and GC skew respectively and the rulers placed at the top and the bottom of each graph shows the size in Mbp. A TW10 TP6 LEM457 LEM451 LMR013 LMR001 Ensifer aridi 0 1 2 3 4 5 6 7 8 9 B USDA 1002 Rm41 M195 Kh12g HM007-17 1021 Ensifer meliloti 0 1 2 3 4 5 6 7 8 9 C M22 M1 Kh53a Kh36d A321 WSM 419 Ensifer medicae 0 1 2 3 4 5 6 7 8 9 D CCBAU083753 CCBAU 083643 CCBAU045436 CCBAU 00557 USDA 207 USDA 205 Ensifer fredii 0 1 2 3 4 5 6 7 8 9 Size of Ensifer pangenomes (Mbp)
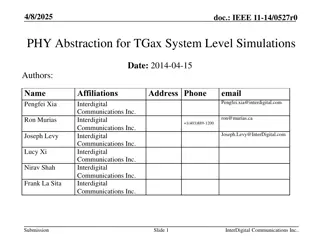
Figure S6. COG classification of Ensifer species and genus conserved PEG sets. The number of PEGs for which at least one COG class could be assigned and those without COG attribute are indicated at the bottom of each piled bar. The species conserved gene sets indicated by (*) correspond to core genomes at the species level estimated on the basis of 6 genomes to which the conserved gene set at the genus level (based on 28 genomesequences belongingto 8 species)indicated by (**) were subtracted. 100% 90% 80% 70% 60% 50% 40% 30% 20% 10% 0% E. aridii * E. meliloti * E. medicae * E. fredii * Core Genus ** No COG assigned 914 1016 1198 998 192 COG assigned 1674 2181 2295 1925 2347
Figure S7. Predicted Insertion sequences and prophage regions in Ensifer strains and species. The left horizontal histogram shows the number of IS predicted by Issaga and the right horizontal piled histogram shows the number of intact, questionable or incomplete prophage regions identified predicted by PHAST in the genomes of the studied strains (indicated in the center of the graph). For each species, the totalnumber of predicted ISs and related ORFs found in the 6 genomesare indicatedon the left of the histogram. 1082 ISs 1237 ORFs E. fredii 1274 ISs 1562 ORFs E. medicae 789 ISs 931 ORFs E. meliloti 471 ISs 537 ORFs E. aridi Nb of prophage regions predicted Nb of IS predicted strain
Figure S8. Malonate utilization in strains LMR001, LEM451, TP6 and E meliloti. To demonstrate the utilization of malonate in selected strains, the minimal AT medium was complemented with malonate, succinate or a mixture of the two C sources and the delta growth (expressed as the OD at 600 nm) obtained upon 5 days incubation was recorded together with standard errors obtained from replicates. Malonate (40 mM) 0.7 Succinate (40 mM) OD(600 nm) upon 5 days of growth 0.6 Malonate (20 mM) Succinate (20 mM) 0.5 0.4 0.3 0.2 0.1 0 LMR001 LEM451 TP6 E. meliloti 1021