Explore the methylation patterns in thelytokous and fertilized embryos through direct sequencing and comparison of methylated CG sites. Supplementary figures and tables provide insights into non-CG methylation, fold coverage, and methylation differences in specific genomic regions.
Please find below an Image/Link to download the presentation.
The content on the website is provided AS IS for your information and personal use only. It may not be sold, licensed, or shared on other websites without obtaining consent from the author. If you encounter any issues during the download, it is possible that the publisher has removed the file from their server.
You are allowed to download the files provided on this website for personal or commercial use, subject to the condition that they are used lawfully. All files are the property of their respective owners.
The content on the website is provided AS IS for your information and personal use only. It may not be sold, licensed, or shared on other websites without obtaining consent from the author.
E N D
Presentation Transcript
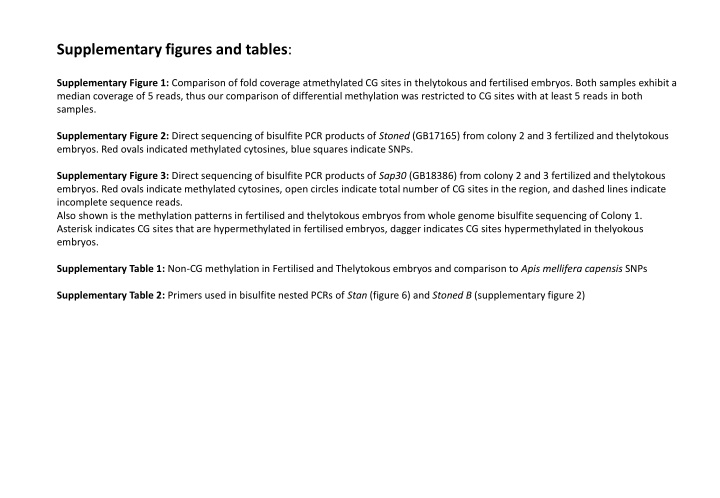
Supplementary figures and tables: Supplementary Figure 1: Comparison of fold coverage atmethylated CG sites in thelytokous and fertilised embryos. Both samples exhibit a median coverage of 5 reads, thus our comparison of differential methylation was restricted to CG sites with at least 5 reads in both samples. Supplementary Figure 2: Direct sequencing of bisulfite PCR products of Stoned (GB17165) from colony 2 and 3 fertilized and thelytokous embryos. Red ovals indicated methylated cytosines, blue squares indicate SNPs. Supplementary Figure 3: Direct sequencing of bisulfite PCR products of Sap30 (GB18386) from colony 2 and 3 fertilized and thelytokous embryos. Red ovals indicate methylated cytosines, open circles indicate total number of CG sites in the region, and dashed lines indicate incomplete sequence reads. Also shown is the methylation patterns in fertilised and thelytokous embryos from whole genome bisulfite sequencing of Colony 1. Asterisk indicates CG sites that are hypermethylated in fertilised embryos, dagger indicates CG sites hypermethylated in thelyokous embryos. Supplementary Table 1: Non-CG methylation in Fertilised and Thelytokous embryos and comparison to Apis mellifera capensis SNPs Supplementary Table 2: Primers used in bisulfite nested PCRs of Stan (figure 6) and Stoned B (supplementary figure 2)
Supplementary Figure 1 30 25 20 Fold Coverage 15 10 5 Thelytokous.Eggs Thelytokous Embryos Fertilised.Eggs Fertilised Embryos Methylated CGs Supplementary Figure 1: Comparison of fold coverage at methylated CG sites in thelytokous and fertilised embryos. Both samples exhibit a median coverage of 5 reads, thus our comparison of differential methylation was restricted to CG sites with at least 5 reads in both samples
Supplementary Table 1 Supplementary Table 1: Non-CG methylation in Fertilised and Thelytokous embryos and comparison to Apis mellifera capensis SNPs Fertilised Thelytokous Both Total number of cytosine sites methylated 158,894 113,361 75,060 Number of non-CG (CHH+CHG) methylated sites 44,741 13,437 561 - CA / GT - CT / GA - CC / GG - CN / NC 28,945 12,969 2,825 3 8,949 3,708 781 0 467 50 33 0 Percent of total methylation that is non-CG 28% 12% 0.7% Number of non-CG sites from Amel2.0 corresponding to SNPs in Capensis2.0 361 113 6 Number of non-CG sites from Amel2.0 corresponding to vector/mammalian contamination 718 51 33 Fertilised Thelytokous Both Fold coverage of bisulfite reads when aligned to Capensis2.0 8.2 10.6 - Fold coverage of bisulfite reads when aligned to Amel2.0 8.6 10.1 - Fold coverage of Capensis reads from Wallberg et al (56) to A.mel 2.0 Reference 16.8 Total number of Capensis SNPs identified 1,613,015
Supplementary Table 2 Supplementary Table 2: Primers used in bisulfite nested PCRs of Stan (figure 6), Stoned B (supplementary figure 2; Drewell et al (33), Sap30 (supplementary figure 3), Syd and Pcl (data not shown) * Primers (5 -3 ) Template volume Annealing Temperatur e Product size Stan (GB18207) 1. BS PCR F ATTTTTGAGGTAATAGGGTATTTAATTG 1 l/10 l 50 C 793 bp R AAAAAAAACTTCCAAATCTTATAAC 2. Nested PCR F TATTAAGAGGTATTTTTATTTTAGAATATG 0.5 l/10 l 57 C R CAAAAACCTAATCTCTTCAACTATACCTC Stoned B (GB17165) 1. BS PCR F GAGTATGATTGTATTTTTTTTTG 1 l/10 l 50 C 650 bp R TCCTTATCCTCTCTACTATTAAA 2. Nested PCR F GYGTTTTTTTGTAAATTGTTGATATTGAT 0.5 l/10 l 57 C R CCTTATAAAAAATATATTACAACTTCTCC Sap30 (GB18386) 1. BS PCR F GGTATAGTGTAAGTAGGAAAATTGTGG 1 l/10 l 50 C 1022 bp R ATTCATATCCAAACCACTACTCTCC 2. Nested PCR F TAATTTTAATTTTTAATGATATAATTTGATG 0.5 l/10 l 57 C R CCACAAAACACTACCCTAATAACTC Syd (GB15356) 1. BS PCR F TTAATAGTTAAAGTAGATGAATTTATAAGG 1 l/10 l 50 C 1224 bp R CAAATATATCCCCACTATAAATAATAAATC 2. Nested PCR F TATAATATTAATATGTTTTTTAGTGAATAAG 0.5 l/10 l 57 C R AATTTTATCTATATACAATAAACCATAATCC Pcl (GB18386) 1. BS PCR F TTATTGTTTTGTGTGATTATAGAAATAGGG 1 l/10 l 50 C R ATTTCCTTACTTTTCTATATCTAACTTCTC 2. Nested PCR 1 F GAAAATGTTAGAGTTAGAAGAAAGTTTGG 0.5 l/10 l 57 C 1040 bp R CATTTATATATACCATTCACCATTAAATCC 3. Nested PCR 2 F ATTATAGTTTAATATGTTAAATTGGGATG 0.5 l/10 l 57 C 1375 bp R CTTAAACCTTACTCAAAACAACATCACC *BS PCR template: bisulfite-converted DNA; nested PCR template: PCR product from BS PCR. Template volumes: template volume/reaction volume.


")