Comparing Functions in Various Forms to Enhance Understanding
Learn how to compare functions represented in graphs, tables, equations, and verbal descriptions. Understand the relationship between slope, rate of change, and function behavior. Explore examples of different functions through visual aids and equations.

Uploaded on | 1 Views
Download Presentation

Please find below an Image/Link to download the presentation.
The content on the website is provided AS IS for your information and personal use only. It may not be sold, licensed, or shared on other websites without obtaining consent from the author. If you encounter any issues during the download, it is possible that the publisher has removed the file from their server.
You are allowed to download the files provided on this website for personal or commercial use, subject to the condition that they are used lawfully. All files are the property of their respective owners.
The content on the website is provided AS IS for your information and personal use only. It may not be sold, licensed, or shared on other websites without obtaining consent from the author.
E N D
Presentation Transcript
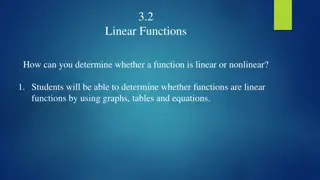
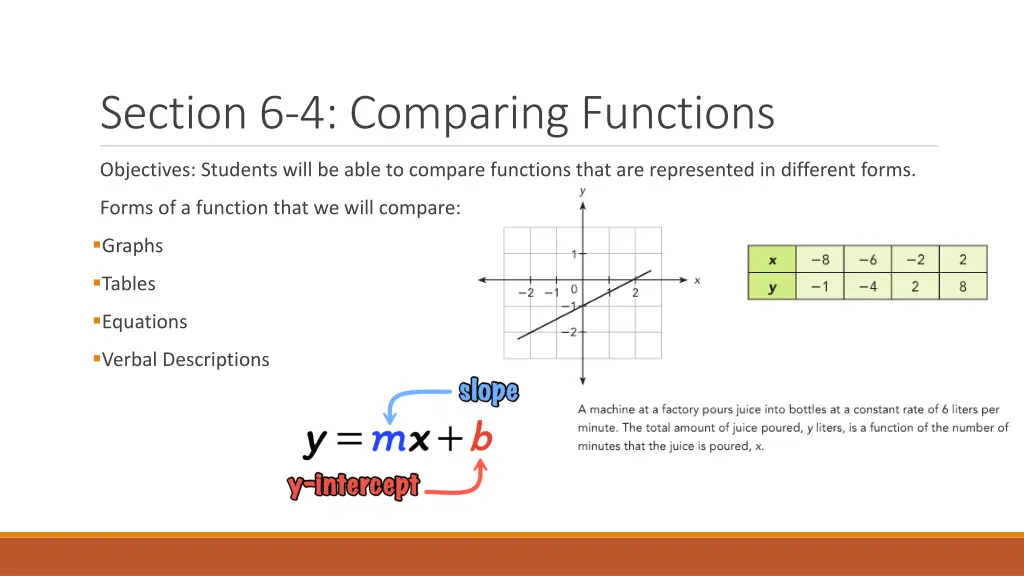
Section 6-4: Comparing Functions Objectives: Students will be able to compare functions that are represented in different forms. Forms of a function that we will compare: Graphs Tables Equations Verbal Descriptions
Review: Find the slope using the slope formula. Then, write the equation of the line. Is this function increasing or decreasing? How does that answer affect our slope? ? ? ? ?= ? ? Now, write the equation of the line. y = -? ?x + 7
Review: Find the equation of the line through (3, 2) and (-9, -14) 2. Solve for b. 3. Write the equation. 1. Find the slope. y = mx + b y = mx + b y = ? 2 =? ?x 2 ?(3) + b -14 2 -9 3 Is this function increasing or decreasing? How can you tell? 2 = 4 + b -16 -12 or 3 4 b = -2 It is increasing, because the slope is positive.
If it didnt tell us, how would we know these are functions? They pass the vertical line test any vertical line would touch the graph only once. What do these two functions have in common? Linear (both have a constant rate of change) Both have a y-intercept of 0 (initial value of 0) Both are increasing functions (positive rate of change)
How are these functions different? They represent two different people (Lara and Dion) They have different slopes (one is steeper than the other) y-intercept of Lara s graph is 0. Equation for Lara is y = 15x + 0, or just y = 15x y = 15x
y-intercept of Dions graph is 0. Equation for Dion is y = 20x + 0, or just y = 20x y = 20x y = 15x
y = 15x y = 20x Who is going faster, and how much faster is she going? Dion is going 5 kilometers per hour faster. In a function, each input produces only one output. How can we obtain a table of values from the equations of the lines? How does the rate of change shown in the equation reflect in the table of values? x y x y 0 0 0 0 Substitute MEANINGFUL values of x into the equation and solve for y. 1 15 1 20 It is the ratio ? ???? ?? ? ? ???? ?? ? From any point to another. 2 30 2 40 How does the table tell us this is a function? 3 45 3 60
How do we know both of these tables are showing linear functions? Are the functions increasing or decreasing, and how do we know? Because the rate of change for each Shop is positive, they are both increasing functions. As the weight of potatoes purchases increases, the total cost increases.
As we can see, in both shops the cost of potatoes is an increasing, linear function with respect to the weight purchased.
Since they are both linear functions, both should have an equation in the form ? = ?? + ?
By comparing the rate of change we can see that Shop B sells potatoes for a lower cost. The rate of change in Shop A is 60, meaning they charge 60 cents per pound. The rate of change in Shop B is 50, meaning it sells potatoes for 50 cents per pound.
Assignment: Due Tuesday, May 5th at 3 pm (follow the worksheet) 1. Review Problems from 6.4 Day 2 worksheet #1 and #2 2. Book problems: page 285 Guided Practice #2 and page 287 #10 #10 will ask you to graph 2 intersecting lines on the same coordinate plane. Homework Reminders Follow directions! Some of you are missing parts of assignments. (like page 376, 5-10 which was due last week) Submit through Teams if you can; otherwise, e-mail a clear picture. In Teams, make sure you turn in your assignment or it just sits there. All work submitted by 10 pm Sunday has been graded. If you turned in something and it is not in PowerSchool, please contact me!


 and")