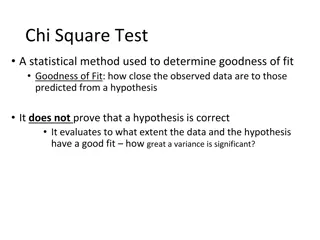
Comparing Groups II - Lecture Summary and Hypothesis Testing Review
This content discusses the various tests for comparing means in statistical analysis, including one-sample and two-sample t-tests. It also covers checking assumptions, such as normality, and provides examples for better understanding. The lecture reviews hypothesis testing methods from the previous session, focusing on tests for numerical variables. Explore topics like chi-squared test, binomial test, and proportion tests for different scenarios. Dive into the applications of comparing means for different groups and learn about the significance of mean comparisons in statistical analysis.

Uploaded on Feb 28, 2025 | 1 Views
Download Presentation

Please find below an Image/Link to download the presentation.
The content on the website is provided AS IS for your information and personal use only. It may not be sold, licensed, or shared on other websites without obtaining consent from the author.If you encounter any issues during the download, it is possible that the publisher has removed the file from their server.
You are allowed to download the files provided on this website for personal or commercial use, subject to the condition that they are used lawfully. All files are the property of their respective owners.
The content on the website is provided AS IS for your information and personal use only. It may not be sold, licensed, or shared on other websites without obtaining consent from the author.
E N D
Presentation Transcript
BUSQOM 1080 Comparing Groups II Fall 2020 Lecture 8 Professor: Michael Hamilton Lecture 8 - Comparing Groups II
Lecture Summary 1. Recap hypothesis testing from Lecture 7 [5 Mins] 2. Discuss tests for comparing means! Run them in R using t.test() 1. One sample t-test [10 Mins] 2. Two sample t-test [5 Mins] 3. Checking assumptions of t.tests, normality with qqplots 1. Normality assumptions with qqnorm() [5 Mins] 2. Independence assumption and paired two-sample t-test [5 Mins] 4. Examples! [5 Mins] Lecture 7 - Comparing Groups 1 2
Data for Lecture Save cba_admissions_1999.txt cba_admissions_1999.txt in your working directory cba =read.table( cba_admissions_1999.txt , sep = "\t", header = T, quote = , allowEscapes = T) 880 obs of applicants to cba in 1999 Contains demographic info + scores 3 Lecture 13 - Model Selection
Hypothesis testing so far Last time: 1. chisq.test() - Test for comparing counted against some expectation 2. binom.test() Exact test proportions for binary counts 3. prop.test() Application of chi.sq test to the special case of proportions across groups. Last time we learned tests for counts categorical variables (factors), what about testing hypotheses involving numerical variables? Today: Tests for comparison of means Lengths of time (e.g., flight delays between airlines), money (e.g., sales between departments), distances (travel paths for bird migration), etc. Lecture 8 - Comparing Groups II 4
Lecture 7 Review Type of Data Test Application Test R function Notes Compare group counts (one factor) Chi-Squared Test chisq.test(table of counts for one factor) Any number of groups > 5 expected counts Any number of groups > 5 expected counts Test if two factors are related Chi-Squared Test chisq.test(table of counts for two factors) OR chisq.test(factor variable 1, factor variable 2) binom.test(count of interest, sample size, p = test value, alternative, conf.level) One-sample test: compare one proportion to a given value Two sample test: compare proportions of two groups Binomial Test Exact test Categorical Data Test for Proportions prop.test(table of counts [rows = 2 groups and columns = 2 outcomes], alternative, conf.level) OR prop.test(group counts, group sample sizes, alternative, conf.level) Limited to 2 groups Computes confidence interval Notes: Parameters of .test() functions alternative = two.sided , greater , or less conf.level = X, X is usually 0.95, but any value between 0 and 1 is valid Lecture 8 - Comparing Groups II 5
Topic: Tests for Comparing Means Application 1: Compare a mean to a specific value. Example: Is the average flight delay significantly greater than 15 minutes? Application 2: Compare means for two groups Example: Are the average flight delay times significantly different for RegionEx and MDA? Application 3: Compare means for more than 2 groups Example: Does the average flight delay differ by day of the week? Lecture 8 - Comparing Groups II 6
General Framework of Hypothesis Testing 1. State hypothesis (and assumptions) 2. Observe a sample of data: X1 , X2 , , XN 3. Compute statistic: T = f(X1 , X2 , , XN) 4. Based the hypothesis and possibly some assumptions about the data, know* the distribution of T, call it F. 5. Use F to measure the probability of T occurring under the hypothesis i.e. compute the p-value 6. Evaluate your hypothesis Lecture 7 - Comparing Groups 1 7
Motivation: t.tests (one sample) Problem: Want to test if a sample drawn from an unknown Normal Distribution X1 , X2 , , XN ~ N(?, ), has mean equal (or greater/less) to some number . If we knew the true variance of the underlying dist. , we could compute a Z statistic: ? ? = / ? If X1 , X2 , , XN are i.i.d. normal, Z is a standard normal random variable and we can easily compute p values. Lecture 7 - Comparing Groups 1 8
Motivation: t.tests (one sample) Problem: Want to test if a sample drawn from an unknown Normal Distribution X1 , X2 , , XN ~ N(?, ), has mean equal (or greater/less) to some number . Since we don t know the true variance , and instead use the sample variance sN = 1 ? ?(?? ?)2, and compute: ? T = sN / ? The distribution of T is not normal, it s the t-distribution! Good news! When N is large, sN is very close to by CLT. Lecture 7 - Comparing Groups 1 9
One sample t.test() in R R will handle compute the t-distribution of statistic T To do t-tests in R we use the t.test() function, that takes in a vector of numeric data and a null hypothesis. Example Using CBA data the average test score (Max_Test_Score) was 1158 Qu: Was the average test score among all students admitted to CBA less than 1200? Lecture 8 - Comparing Groups II 10
One sample t.test() in R Qu: Was the average test score among all students admitted to CBA less than 1200? Value to test greater , less , or two.sided Column to test Level for confidence interval Lecture 8 - Comparing Groups II 11
One sample t.test() in R Qu: Was the average test score among all students admitted to CBA less than 1200? p-value for test what we re testing confidence interval (only relevant for two-sided test) average is shown Since the p-value is very small, stat. sign. evidence the mean is less 1200 Lecture 8 - Comparing Groups II 12
Motivation: two sample t.tests Problem: Want test if two samples drawn from an unknown Normal Distributions X1 , X2 , , XN~ N(?, 1) and Y1 , Y2 , , YM ~ N(?, 2) and have different means. T statistic here is uses same idea, a little bit more complicated ? ? (?? ?)2 + (?? ?)2 ? + ? 2 T = ?2= ?2(1 ?+1 ?) It turns out this statistic T also has a t-distribution Lecture 7 - Comparing Groups 1 13
Two sample t.test() in R The format of the R command is: t.test(numeric variable ~ grouping variable, alternative, conf.level) Example Qu: Are the avg. test scores different for students who paid deposits versus students who did not? Lecture 8 - Comparing Groups II 14
Two sample t.test() in R Qu: Are the avg. test scores different for students who paid deposits versus students who did not? Numeric column to test Grouping variable (2 values) greater , less , or two.sided Level for confidence interval Lecture 8 - Comparing Groups II 15
Two sample t.test() in R Qu: Are the avg. test scores different for students who paid deposits versus students who did not? p-value for test what we re testing confidence interval (only relevant for two-sided test) Averages for two groups shown Since the p-value is close to 0.01, the two means are stat. sign. diff. Lecture 8 - Comparing Groups II 16
Assumptions for t-tests 1. Normally Distributed Data Both groups should consist of independent draws from Normal distributions! Tip: When number of samples is big it s a not a big deal if normality is violated 2. Independence between groups, and samples Possible problems: 1. Cluster effect: Data collected in subgroups 2. Serial effect: Measurements taken close together in time tend to be more similar than those taken at distant time points 3. Spatial correlation: Same idea as serial correlation but over space instead of time 4. Measurement before and after some treatment! Lecture 8 - Comparing Groups II 17
Assumptions for t-tests: Normality Check qqplot of data using qqnorm() command. Plots the quantiles of the data, Rule: If not diagonal, then data is not normal! Example: > qqnorm(cba$SAT_math) If violated, report so. May need to use a a data transformation (more on this after the midterm!) Lecture 8 - Comparing Groups II 18
Assumptions for t-tests: Independence What about when samples aren t independent across groups? In many applications data is taken before and after a treatment, on the same set of individuals Group 1 (before): X1 , X2 , , XN Group 2 (after): X1+D1 , X2 + D2 , , XN + DN Issue: If X s and D s are independent, var(X+D) = var(X) + var(D) > var(D) This affects how we compute our sample variances, don t want to double count the variance from X. Lecture 8 - Comparing Groups II 19
Topic: Paired t-test One way independence can be violated is when the samples are paired i.e. the obs. in the two samples are in correspondence like in the previous slides example. In this case use a paired t.test(). Lecture 8 - Comparing Groups II 20
Topic: the effect of outliers on t.tests Since t-tests are based on means, extreme outliers and other data changes may significantly affect the results! Not resistant to changes in part of the data While slight non-normality can be okay, outliers can be disastrous! May choose to analyze data with and without outliers and compare results, more on this as well after the midterm. Lecture 8 - Comparing Groups II 21
Review Type of Data Test for Means (Normal Distribution) Test Application R function One-sample test: compare mean or median to a given value t-test for population mean t.test(numeric variable, mu = test value, alternative, conf.level) Numeric Data Two sample test: compare means or medians of two groups t-test for the difference between group t.test(numeric variable ~ grouping variable, alternative, conf.level) Notes: alternative = two.sided , greater , or less conf.level = usually 0.95, but any value between 0 and 1 conf.int = TRUE or FALSE Lecture 8 - Comparing Groups II 22


")
")
 in R")
 in R")
 in R")

 in R")
 in R")
 in R")