Comparing Measures of Subjective Well-Being

Subjective well-being research has gained prominence, prompting discussions on the comparability of differently worded measures. The study explores challenges in replicating findings across surveys, questioning the validity of subjective well-being research due to the diverse questions used for measurement. Various scales and guidelines for assessing life satisfaction and happiness are examined, reflecting the increasing popularity of subjective well-being studies.

Download Presentation

Please find below an Image/Link to download the presentation.
The content on the website is provided AS IS for your information and personal use only. It may not be sold, licensed, or shared on other websites without obtaining consent from the author.If you encounter any issues during the download, it is possible that the publisher has removed the file from their server.
You are allowed to download the files provided on this website for personal or commercial use, subject to the condition that they are used lawfully. All files are the property of their respective owners.
The content on the website is provided AS IS for your information and personal use only. It may not be sold, licensed, or shared on other websites without obtaining consent from the author.
E N D
Presentation Transcript
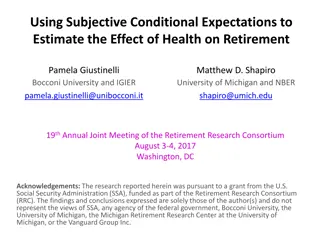
The comparability of differently worded subjective well-being measures Martijn Hendriks, Martijn Burger and Yoshiaki Takahashi IARIW Conference August 2024 Discussion by Andrew Clark (Paris School of Economics CNRS) 1
Well-being has moved away from the fringes of social science research towards the centre 2
But. Have you ever had difficulty in replicating a well-being finding from one survey to another? Do referees give you grief about What does this type of question really mean ? Is the body of subjective well-being research fatally flawed because 3
The questions used to measure it are different? 4
Increasing popularity of subjective well-being, and in the ways in which it is measured Survey Question Scale Panel A: Life satisfaction OECD guidelines Overall, how satisfied are you with life as a whole these days? 0 (not at all satisfied) - 10 (completely satisfied) WVS All things considered, how satisfied are you with your life as a whole these days? 1 (completely dissatisfied) - 10 (completely satisfied) ESS All things considered, how satisfied are you with your life as a whole nowadays? 0 (extremely dissatisfied) - 10 (extremely satisfied) SOEP How satisfied are you with your life, all things considered? 0 (completely dissatisfied) - 10 (completely satisfied) HILDA All things considered, how satisfied are you with your life? 0 (totally dissatisfied) - 10 (totally satisfied) BHP How dissatisfied or satisfied are you with your life overall? 1 (not satisfied at all) - 7 (completely satisfied) Latinobarometro Generally speaking, would you say you are satisfied with your life? 1 (very satisfied) - 4 (not at all satisfied) BRFSS In general, how satisfied are you with your life? 1 (very satisfied) - 4 (very dissatisfied) Eurobarometer On the whole, are you very satisfied, fairly satisfied, not very satisfied or not at all satisfied with the life you lead? 1 (very satisfied) - 4 (not at all satisfied) Panel B: Happiness OECD guidelines Taking all things together, how happy would you say you are? 0 (not at all happy) - 10 (completely happy) ESS Taking all things together, how happy would you say you are? 0 (extremely unhappy) - 10 (extremely happy) WVS Taking all things together, would you say you are: 1 (very happy) - 4 (not at all happy) GSS Taken all together, how would you say things are these days--would you say that you are very happy, pretty happy, or not too happy? 1 (very happy) - 3 (not too happy) CGSS Generally speaking, do you think your life is happy? 1 (very unhappy) - 5 (very happy) 5
And their differences Question aspect Wording Panel A: Life satisfaction Question tone positive (7); neutral (2) Scope wording all things considered (3); overall (2); generally speaking (1); in general (1); on the whole (1) Place of scope wording beginning (7); end (2) Secondary scope wording as a whole (3); none (6) Time scope these days (2); nowadays (1); none (6) Scale label numerical (6); verbal (3) Scale type unipolar (4); bipolar (5) Scale extremes completely (4); very (3); extremely (1); totally (1) Panel B: Happiness Question tone positive (3); neutral (2, of which 1 open) Scope wording taking all things together (3); Taken all together (1); generally speaking (1) Place of scope wording beginning (5) Time scope these days (1); none (4) Scale label numerical (2); verbal (3) Scale type unipolar (3); Bipolar (2) Scale extremes very (3); extremely (1); completely (1) 6
Main question: Does the wording of SWB measures affect the outcomes? We suspect that it might due to framing and anchoring 7
What would the SOEP life satisfaction distribution look like with the UKHLS question and scale? Problem of experimenter demand if the same question asked twice So turn to split ballots, as in Deaton, OEP (2012). 8
Gallup Healthways Wellbeing Index poll: a telephone poll of 1,000 Americans each day, contains the Cantril Self-Anchoring Striving Scale. Please imagine a ladder with steps numbered from zero at the bottom to 10 at the top. The top of the ladder represents the best possible life for you and the bottom of the ladder represents the worst possible life for you. On which step of the ladder would you say you personally feel you stand at this time? (ladder-present) On which step do you think you will stand about five years from now? (ladder-future)
For a period, in the US survey, the Cantril ladder was preceded by questions about the President and the US economy: 10
Gallup subsequently ran a RCT, dividing respondents into 500 who received the political questions, and 500 who did not ( split ballot approach). Deaton, OEP, (2012). The main effect of the context questions is sharply negative, reducing the Cantril scores by 2/3 of a point. Also changes the correlates of well-being 11
12Treatment effect of priming larger for Whites (-0.65) than for Blacks (-0.5); largest for Other (-0.75)
Carrying out this analysis across the permutations below is a huge amount of work Survey Question Scale Panel A: Life satisfaction OECD guidelines Overall, how satisfied are you with life as a whole these days? 0 (not at all satisfied) - 10 (completely satisfied) WVS All things considered, how satisfied are you with your life as a whole these days? 1 (completely dissatisfied) - 10 (completely satisfied) ESS All things considered, how satisfied are you with your life as a whole nowadays? 0 (extremely dissatisfied) - 10 (extremely satisfied) SOEP How satisfied are you with your life, all things considered? 0 (completely dissatisfied) - 10 (completely satisfied) HILDA All things considered, how satisfied are you with your life? 0 (totally dissatisfied) - 10 (totally satisfied) BHP How dissatisfied or satisfied are you with your life overall? 1 (not satisfied at all) - 7 (completely satisfied) Latinobarometro Generally speaking, would you say you are satisfied with your life? 1 (very satisfied) - 4 (not at all satisfied) BRFSS In general, how satisfied are you with your life? 1 (very satisfied) - 4 (very dissatisfied) Eurobarometer On the whole, are you very satisfied, fairly satisfied, not very satisfied or not at all satisfied with the life you lead? 1 (very satisfied) - 4 (not at all satisfied) Panel B: Happiness OECD guidelines Taking all things together, how happy would you say you are? 0 (not at all happy) - 10 (completely happy) ESS Taking all things together, how happy would you say you are? 0 (extremely unhappy) - 10 (extremely happy) WVS Taking all things together, would you say you are: 1 (very happy) - 4 (not at all happy) GSS Taken all together, how would you say things are these days--would you say that you are very happy, pretty happy, or not too happy? 1 (very happy) - 3 (not too happy) CGSS Generally speaking, do you think your life is happy? 1 (very unhappy) - 5 (very happy) 13
HBT take the same (between-subject) split ballot approach in four Greek/Dutch/Japanese samples Experiment N Sample 1 2 3 4 421 1,611 1,043 Dutch & international students English 16 (2x8) Question tone Scope wording Scale wording Life satisfaction and happiness Yes 4,669 Greek students Representative of the Dutch adult population Dutch 5 Question tone Representative of the Japanese adult population Japanese 8 Question tone Scope wording Scale wording Life satisfaction Survey language Experimental conditions Question wording focus Greek 4 Question tone SWB focus Life satisfaction Happiness Questions on mechanisms No No No 15
RESULTS FOR QUESTION TONE (POSITIVE, NEUTRAL, OPEN, NEGATIVE) Experiment 2 Condition Question 1 3 4 Life satisfaction Satisfied1 Dissatisfied or satisfied Open Dissatisfied Happiness Happy2 Happy or unhappy Unhappy or happy Open Unhappy All things considered, how satisfied are you with your life as a whole these days? All things considered, how dissatisfied or satisfied are you with your life as a whole these days? All things considered, how do you feel about your life as a whole these days? All things considered, how dissatisfied are you with your life as a whole these days? Taking all things together, how happy would you say you are? Taking all things together, how happy or unhappy would you say you are? Taking all things together, how unhappy or happy would you say you are? Taking all things together, would you say you are? Taking all things together, how unhappy would you say you are? 1 Measure from the World Values Survey. Response scale: 0 (completely dissatisfied) - 10 (completely satisfied) 2 Measure from the European Social Survey. Response scale: Extremely unhappy - Extremely happy (1-7 or 0-10) 16
MEANS: ALL 0-10 Experiment 4: Japan Experiment 1: Greece Experiment 2: Netherlands Experiment 3: Students Condition Panel A: Life satisfaction Mean SD Mean SD Mean SD Mean SD Satisfied 7.17 7.27 5.86 Dissatisfied or satisfied 7.17 7.07 5.67 Open 6.87 6.90 5.80 Dissatisfied 7.14 7.13 5.54 Panel B: Happiness Happy 5.34 7.14 Happy or unhappy 5.33 7.05 Unhappy or happy 5.31 Open 5.22 Unhappy 5.29 6.32 Note: Means and standard deviations (SD) are adjusted for differences in all covariates used in the randomization check. Some evidence of higher scores with positive question tone 17
RESULTS: QUESTION TONE Experiment 4: Japan Experiment 1: Greece Experiment 2: Netherlands Experiment 3: Students Condition Panel A: Life satisfaction Mean SD Mean SD Mean SD Mean SD Satisfied 7.17 0.89 7.27 0.85 5.86 1.12 Dissatisfied or satisfied 7.17 0.96 7.07 0.94 5.67 1.32 Open 6.87 1.10 6.90 1.21 5.80 1.18 Dissatisfied 7.14 0.84 7.13 1.37 5.54 1.46 Panel B: Happiness Happy 5.34 0.55 7.14 0.89 Happy or unhappy 5.33 0.51 7.05 0.94 Unhappy or happy 5.31 0.55 Open 5.22 0.55 Unhappy 5.29 0.57 6.32 1.78 Note: Means and standard deviations (SD) are adjusted for differences in all covariates used in the randomization check. Lower means go with higher dispersion (ceiling effect) 18
EXPERIMENTAL CONDITIONS: OTHER WORDING DIFFERENCES LIFE SATISFACTION Condition Satisfied1 Question All things considered, how satisfied are you with your life as a whole these days? Response scale 0 (completely dissatisfied) - 10 (completely satisfied) 0 (not at all satisfied) - 10 (completely satisfied) 0 (totally dissatisfied) - 10 (totally satisfied) 3 4 Satisfied (short)2 Satisfied (overall)3 Satisfied (overall; unipolar)4 Satisfied (short; totally)5 All things considered, how satisfied are you with your life? Overall, how satisfied are you with life as a whole these days? Overall, how satisfied are you with life as a whole these days? All things considered, how satisfied are you with your life? 1 Measure from the World Values Survey. 2 Question (not scale) from HILDA. 3 Recommended question (not scale) by the OECD guidelines. 4 Recommended measure by the OECD guidelines. 5 Measure from HILDA. 19
EXPERIMENTAL CONDITIONS: OTHER WORDING DIFFERENCES HAPPINESS Condition Happy1 Question Taking all things together, how happy would you say you are? Response scale 0 (extremely unhappy) - 10 (extremely happy) 0 (not at all happy) - 10 (completely happy) 3 Happy (unipolar)2 Taking all things together, how happy would you say you are? Happy (short; unipolar) Overall, how happy do you feel? 4-item Taking all things together, would you say you are: 1 (very happy) 4 (not at all happy) Open (verbal; short)3 Open (verbal)4 Taken all together, how would you say things are these days? Would you say that you are ? Taken all together, how would you say things are these days? Would you say that you are ? Open (verbal; bipolar)5 1 (very happy) - 4 (very unhappy) 1 Measure from the European Social Survey. 2 Recommended measure by the OECD guidelines. 3 Measure from the World Values Survey. 4 Question (not scale) from the General Social Survey. 5 Measure from the General Social Survey. 20
RESULTS: OTHER WORDING DIFFERENCES Experiment 4 Experiment 3 Condition Panel A: Life satisfaction Mean SD Mean SD Satisfied 7.27 0.85 5.86 1.12 Satisfied (short) 7.12 1.06 5.83 1.09 Satisfied (overall) 7.13 1.03 5.86 1.14 Satisfied (overall; unipolar) 7.06 0.82 5.84 1.18 Satisfied (short; totally) 7.21 1.05 5.81 1.23 Panel B: Happiness Happy 7.14 0.89 Happy (unipolar) 7.18 0.90 Happy (short; unipolar) 7.35 0.96 Open (verbal; short) 3.17 0.45 Open (verbal) 3.13 0.51 Open (verbal; bipolar) 3.03 0.45 Note: Adjusted means and standard deviations (SD) reported as in Table 5. SWB results are not sensitive to these types of scope wording and the shortening of questions 21
Differences in means are easy to control for. What about differences in predictors? 22
FEW SIGNIFICANT DIFFERENCES: EXAMPLE FROM EXPERIMENT 4 (QUESTION TONE) (1) (2) (3) (4) (5) Dissatisfied or satisfied 0.55** 0.77** 1.41** 1.24** 0.79** 1.05** 1.21** 1.01** -0.76** -0.22 -0.54** -0.88** -0.66** -0.71** -0.35** 0.18 -0.24* -0.23 -0.67** 0.13** -0.14** 0.16** 0.14 0.79** -0.04 1.12** 0.99** Significant differences Satisfied Open Dissatisfied Future happiness Health Sat: job Sat: family Sat: partner Sat: friends Sat: environment Sat: community Financial struggle Worry: COVID Worry: health Worry: stress Worry: job loss Worry: wage cut Worry: bankruptcy Worry: community Worry: loans Worry: child s future Worry: retirement HH income (log) Age Age squared Employed Highly educated Female Partner Has children 0.49** 0.89** 1.31** 1.33** 1.03** 1.29** 1.39** 1.16** -0.76** -0.05 -0.36** -0.72** -0.70** -0.53** -0.51** -0.09 -0.32** -0.09 -0.50** 0.11** -0.10** 0.12** 0.27 0.47** 0.33 1.22** 1.02** 0.51** 1.00** 1.29** 1.33** 1.20** 1.35** 1.32** 1.12** -0.68** -0.13 -0.54** -0.80** -0.54** -0.58** -0.47** -0.17 -0.26* -0.43** -0.55** 0.18** -0.18** 0.21** 0.46* 0.55** 0.21 1.53** 1.40** 0.55** 0.92** 1.48** 1.15** 1.00** 1.16** 1.18** 1.13** -0.68** -0.46** -0.61** -0.84** -0.81** -0.64** -0.58** -0.28* -0.35** -0.50** -0.65** 0.11* -0.13** 0.13** 0.02 0.72** 0.31 1.31** 1.28** 3>2 1+3>4 2>4 23
PREDICTORS: ALL EXPERIMENTS The number of significant differences corresponds to that from chance. Differences no higher for conditions with different means / SD s. No systematic patterns in how specific covariates differ across conditions. No evidence that negative variables (e.g. worry) relate more strongly to conditions with negative/neutral question tones. Similar results with all covariates simultaneously. 24
CONCLUSION Nothing really matters, anyone can see 25
TWO EXPERIMENTS ADDRESS MECHANISMS: RESULTS FROM EXPERIMENT 3) Dissatisfied or satisfied 7.4 6.3 5.8 4.1 11.9 1.5 Significant differences Satisfied Open Dissatisfied Domain score of focus area Perceived norm Scale interpretation: A bit satisfied Scale interpretation: A bit dissatisfied Response duration Question difficulty 6.8 6.3 5.7 4.0 11.5 1.7 7.3 6.2 5.7 4.0 11.0 1.6 6.9 6.3 5.8 4.2 12.6 1.6 1>2 Satisfied (overall; unipolar) 7.4 6.6 5.6 4.2 9.5 1.6 Satisfied (short; totally) 7.0 6.4 5.7 4.1 8.9 1.6 Satisfied (short) Satisfied (overall) Significant differences Satisfied Domain score of focus area Perceived norm Scale interpretation: A bit satisfied Scale interpretation: A bit dissatisfied Response duration Question difficulty 6.8 6.3 5.7 4.0 11.5 1.7 7.2 6.4 5.5 4.0 9.4 1.5 7.5 6.5 5.7 4.2 10.0 1.6 1<6 26
MY EVALUATION This is an issue that is essential in subjective well-being research It is a lot of work I am glad that someone (else) is doing it Almost all of the questions seem to pick up the same underlying sentiment of good psychological functioning 27
WHERE NEXT? A lot of the grief I get is not about different satisfaction measures, but rather hedonic versus eudaimonic Your motivation is cross-country, but experiments are within-country 28
Correlations between explanatory variables in ESS data (note: not split ballot)
Differences are between countries: within countries the coefficients are very similar A Belgian who is satisfied has high resilience; A Swede who is flourishing is happy
WHERE NEXT? Not sure about worry as a predictor, or domain satisfactions: these are also subjective (Common Method Variance). And the correlation with subjective well- being could depend on the way in which worry/domain satisfaction measured. 31
WHERE NEXT? Try the Cantril ladder? Helliwell (2012) (not split ballot): Different average scores (life satisfaction 0.5 higher) High correlation between the country rankings for life satisfaction and Cantril: r=0.935. Both explained by the same factors, including the same effects of income 32
WHERE NEXT? Test-retest correlations We still use Krueger, A., and Schkade, D. (2008). "The Reliability of Subjective Well-Being Measures". Journal of Public Economics, 92, 1833-45. Which of your measures produces the best T-RT correlation? 33


 than")


 split ballot")