Comparison of Confidence Intervals in Statistics: Bootstrap vs. t-Methods
Explore the comparison of capture rates for confidence intervals using bootstrap and t-methods in statistics. The study analyzes the performance across different population distributions and sample sizes, providing insights into choosing the appropriate method for statistical inference.
Download Presentation

Please find below an Image/Link to download the presentation.
The content on the website is provided AS IS for your information and personal use only. It may not be sold, licensed, or shared on other websites without obtaining consent from the author. If you encounter any issues during the download, it is possible that the publisher has removed the file from their server.
You are allowed to download the files provided on this website for personal or commercial use, subject to the condition that they are used lawfully. All files are the property of their respective owners.
The content on the website is provided AS IS for your information and personal use only. It may not be sold, licensed, or shared on other websites without obtaining consent from the author.
E N D
Presentation Transcript
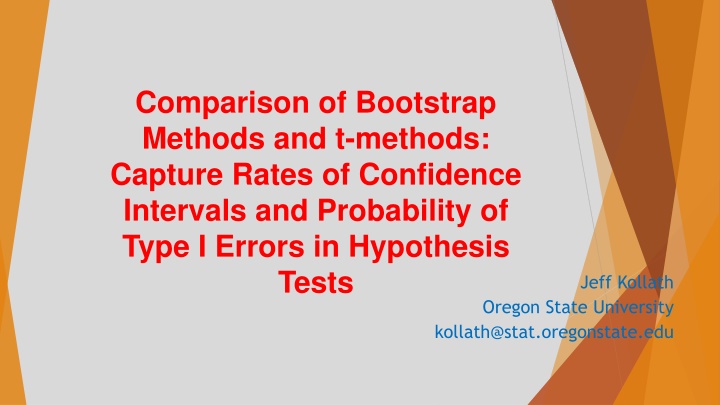
Comparison of Bootstrap Methods and t-methods: Capture Rates of Confidence Intervals and Probability of Type I Errors in Hypothesis Tests Jeff Kollath Oregon State University kollath@stat.oregonstate.edu
Introductory Statistics courses at Oregon State University ST 201/202: 3 credits 3 hours of lecture and 1 hour of recitation each week Traditional approach to teaching introductory statistics ST 351/352: (what I teach) 4 credits 3 hours of lecture and one 80-minute lab each week Use Minitab during labs Inference is introduced using bootstrap methods
Motivation: Inference is introduced using bootstrap and randomization methods Text used: Unlocking the Power of Data by the 5 Lock s (Wiley, 1st edition) Provide a better understanding of sampling distributions and how they are used in inference Methods courses: we use Minitab macros to generate confidence intervals (using percentile methods) and p-values using bootstrap and randomization methods. Students also learn traditional normal-based methods (t-methods, for example) Students often ask which procedure should they use: bootstrap methods or t-methods
Comparison of capture rates for confidence intervals Two different populations were created a population that was normally distributed a population that was heavily right skewed For each population: a random sample was taken from the population of sizes 15, 100, and 500. From the sample data, several 95% confidence intervals were constructed: A 95% confidence interval for the population mean using the t-methods A 95% confidence interval for the population mean from a bootstrap distribution of 2000 sample means using the percentile method A 95% confidence interval for the population median from a bootstrap distribution of 2000 sample medians using the percentile method For each, it was noted whether the population mean (or median) fell between the bounds of the confidence interval. All simulations were done using Minitab
Normal population Skewed population 900 16000 800 14000 700 12000 600 10000 Frequency Frequency 500 8000 400 6000 300 4000 200 2000 100 0 0 5500 11000 16500 22000 data 27500 33000 38500 66 77 88 99 data 110 121 132 143
Results From several thousand simulations, the percent of simulations that had a confidence interval capture the population parameter are given in the table below:
Comparison of probability of Type I Errors in hypothesis tests Two different populations were created a population that was normally distributed a population that was heavily right skewed For each population: a random sample was taken from the population of sizes 15 and 100 was taken. A hypothesis test was performed where the hypothesized parameter (either the mean or the median) was equal to the true population value of the mean or median. For the same sample, a hypothesis test was performed on both the mean and the median The significance level for each hypothesis test was set at 5% The two-tailed p-value for each hypothesis test was determined using the t-methods, bootstrap methods on the mean, and bootstrap methods on the median. Whether or not the null hypothesis was rejected at the 5% significance level was recorded. All simulations were done using Minitab
Results After around 750 simulations, the percent of simulations that had a Type I Error are given in the table below: Skewed pop. Test on mean using t- methods Skewed pop. Test on mean using bootstrap methods 30.73% Skewed pop. Test on median using bootstrap methods normal pop. Test on mean using t- methods normal pop. Test on mean using bootstrap methods normal pop. Test on median using bootstrap methods 27.02% 6.86% 4.72% 8.19% 5.17% n = 15 13.14% 13.81% 4.56% 6.56% 6.83% 5.44% n = 100
Percent of simulations where p-value from t-test was higher than p-value from bootstrap methods: normal population n = 15: 92.50% n = 100: 65.13% skewed population n = 15: 84.77% n = 100: 62.06%
What Id say to the student who asks, Which method should I use? The t-methods perform slightly better than the bootstrap methods for inference about a population mean. However, the difference is slight and the bootstrap methods offer an alternate method for students who prefer and understand simulation better than formula-based methods Do not use either method for inference about a population mean when data are skewed and the sample size is not large enough . How large the sample needs to be depends on how skewed the population data are. When it is not appropriate to use either method for inference about a population mean, inference on the population median using the bootstrap methods is an option.
Contact Information: Jeff Kollath Department of Statistics Oregon State University Corvallis, OR 97331 541-737-3585 kollath@stat.oregonstate.edu

