Comparison of Multimorbidity and Burden of Disease Approaches
In this analysis, a comparison is made between different approaches to understanding multimorbidity and its impact on disease burden. The study delves into prevalence rates, disability weights, and severity of multimorbidity, aiming to enhance the accuracy of Burden of Disease estimates. Various diseases are assessed for prevalence and associated disability weights, shedding light on the complexities of managing multiple conditions simultaneously.

Download Presentation

Please find below an Image/Link to download the presentation.
The content on the website is provided AS IS for your information and personal use only. It may not be sold, licensed, or shared on other websites without obtaining consent from the author.If you encounter any issues during the download, it is possible that the publisher has removed the file from their server.
You are allowed to download the files provided on this website for personal or commercial use, subject to the condition that they are used lawfully. All files are the property of their respective owners.
The content on the website is provided AS IS for your information and personal use only. It may not be sold, licensed, or shared on other websites without obtaining consent from the author.
E N D
Presentation Transcript
Multimorbidity and Bod A comparison of approaches Henk Hilderink
Burden of Disease corrected for multimorbidity In VTV2014 no correction for multimorbidity (implicit assumption of additive) Partial analysis (prevalence of diseases and multimorbidity separately) Objective: Improvement of BoD estimates Prevalence of Multimorbidity Severity of Multimorbidity
Approaches of prevalence and combined disability weights Prevalence of single diseases Disability weights for single diseases Method C: Age-sex specific- All population-Independent Method D: age-sex specific- All population-Dependent Multiplicative Independent Method A: Method B: Method 1: Method 2: Method 3: Dependent Maximum Additive Prevalence of multimorbidity Multimorbidity disability weights Years Lived with Disability (YLD)
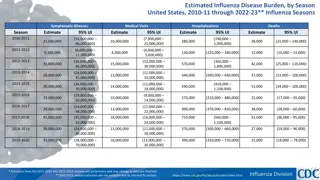
Prevalence DW YLD DALY Arthrosis 7.12% 0.103 122,423 123,509 Anxiety disorders 5.77% 0.187 180,220 180,272 Diabetes mellitus 5.00% 0.198 165,150 194,312 Input data Hearing disorders 4.86% 0.109 88,344 88,344 Mood disorders 2.31% 0.425 164,025 164,592 Neck and back pain 3.91% 0.236 153,930 154,499 Sex-age specific prevalence data Disability weights 25 diseases (out of 56 from VTV selection) Diverse variation of diseases Coronary heart disease 3.62% 0.288 174,090 282,834 Asthma 2.86% 0.080 38,192 39,244 COPD 2.17% 0.314 113,600 177,809 Contact Eczema 1.94% 0.070 22,720 22,720 Visual impairments 1.81% 0.137 41,348 41,375 Cardiac arrhythmias 1.17% 0.154 30,142 48,305 Stroke 1.11% 0.609 113,147 191,320 Breast cancer 0.60% 0.265 26,459 88,019 Heart failure 0.85% 0.154 21,809 67,660 Intellectual disabilities 0.77% 0.430 55,599 56,929 Personality disorders 0.60% 0.273 27,438 27,438 Colon cancer 0.36% 0.294 17,667 87,177 Prostate cancer 0.40% 0.231 15,271 39,403 Dementia 0.48% 0.678 54,744 112,130 Valve problems 0.46% 0.118 9,091 28,346 Skin cancer 0.24% 0.070 2,768 19,446 Lung cancer 0.12% 0.285 5,845 169,120 Parkinson's disease 0.19% 0.497 15,401 25,657 Non-Hodgkin's lymphoma 0.13% 0.233 4,910 20,749
Prevalence of multimorbidity: two diseases Disease A A B Disease B Prevalence A = 10% Prevalence B = 5% Prevalence A = 9.5% Prevalence B = 4.5% Prevalence A B = 0.5% Prevalence A = 8.5% Prevalence B = 3.5% Prevalence A B = 1.5%
C BC A B AB AC ABC B A AB B A AB AC BCD ABD ABC C D ABCD AD BC ACD DC
Method for Prevalence calculation General: Combinations up to 5 diseases considered More than 5 maximum probability of 1.5 in a million With 25 diseases 68.405 unique combinations Four different methods: Method A: total population, independent Method B: total population, dependent Method C: sex-age-specific independent Method D: sex-age-specific dependent Dependent (Method B and D): making use of odds ratios (van Oostrom) for combinations of only 2 diseases ORs are not age-specific (assuming similar OR of 1.3)
Distribution of number of diseases Method A: total population, independent Method B: total population, dependent Method C: sex-age-specific independent Method D: sex-age-specific dependent
Sex-age-specific distribution of number of diseases (method C)
Distribution of number of diseases, by disease Method C: Sex-age-specific
2. Methods for combined disability weights Method 1: Additive ????= ???+ ??? Method 2: Multiplicative ????= 1 1 ??? 1 ??? Method 3: Maximum ????= max ???,???
Results for YLD -26% Method A: total population, independent Method B: total population, dependent Method C: sex-age-specific independent Method D: sex-age-specific dependent
Conclusions Burden of Disease substantially lower when accounting for multimorbidity This might affect intervention analysis (e.g. CEAs) when done partially (intended effect of interventions might be lower) Depends on methodology for prevalence and combined disability (but is a step forward compared to VTV2014) Better understanding of multimorbid conditions on disability (e.g. by looking at specific combinations of diseases Improving methodology for prevalence of multimorbidity e.g. clustering of more than two diseases


")
")