Comparison of Nonprobability Samples in Social Science Research
This study examines the use of nonprobability online panels in social science research, comparing them with probability samples. It explores the conditions under which nonprobability samples can be employed, the comparability of multivariate models generated from online panels with gold standard surveys, and the appropriateness of using nonprobability samples. The research focuses on the quality of experimental data produced by online panels and compares samples from MTurk, Qualtrics Panel, General Social Survey, and American National Election Reconnect Study.
Download Presentation

Please find below an Image/Link to download the presentation.
The content on the website is provided AS IS for your information and personal use only. It may not be sold, licensed, or shared on other websites without obtaining consent from the author.If you encounter any issues during the download, it is possible that the publisher has removed the file from their server.
You are allowed to download the files provided on this website for personal or commercial use, subject to the condition that they are used lawfully. All files are the property of their respective owners.
The content on the website is provided AS IS for your information and personal use only. It may not be sold, licensed, or shared on other websites without obtaining consent from the author.
E N D
Presentation Transcript
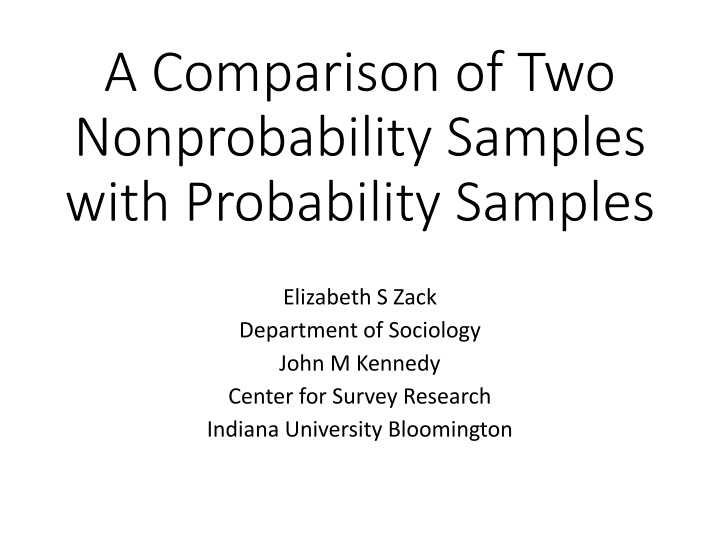
A Comparison of Two Nonprobability Samples with Probability Samples Elizabeth S Zack Department of Sociology John M Kennedy Center for Survey Research Indiana University Bloomington
Research Questions: Under what conditions can nonprobability online panels be used for social science research? Are multivariate models generated from online panels comparable to similar models generated from gold standard surveys? Should social science researchers use nonprobability samples?
Appropriate use of online panels Experiments Online nonprobability samples produce high quality experimental data (e.g., Berinsky et al. 2012; Leeper & Mullinix 2014; Mullinix et al. 2013; Weinberg et al. 2014) Point estimates With appropriate selection procedures and statistical controls, the online panels do reasonably well. Some procedures are better than others (Pew, 2016)
MTurk Amazon product; workers paid for generally small tasks performed online No control on participant characteristics Conducted spring 2015 N = 250 to 350
Qualtrics Panel Qualtrics aggregates participants from opt-in panels Requested demographic controls for age, gender, and region Conducted summer 2015 N = 450 to 550
2014 General Social Survey random sample of US noninstitutionalized population Conducted in-person; April - October n = 1,000 to 2,300 Response rate 69%
2013 American National Election Reconnect Study Online follow-up of ANES 2012 Time Series internet sample Conducted July 2013 n = 1663 Response rate 2% (estimated)
Study Focus Compare GSS and ANES with Mturk and Qualtrics Panel Using GSS/ANES instead of Census or other demographic controls Use similar methods to most social science researchers Not using methods used by survey researchers to evaluate sample quality or develop point estimates Comparison of multivariate models
Survey Questions Dependent Variables Health and Well Being Science Education Family Government Policy Preferences Racial Attitudes Independent Variables Demographics age, gender, region, race & ethnicity, education, marital status, political ideology, party id, income
Data Analysis Frequency distributions Demographics Outcome variables Bivariate associations Multivariate models using demographics with public opinion items Examine effects of sample type on multivariate models Limited number of dependent variables for the models
Age ANES GSS QUALTRICS MTURK
Education ANES GSS MTURK QUALTRICS
Demographic Comparisons Mturk vs GSS more males and whites than GSS MTurk workers have more education, are younger, have lower incomes, are more liberal, are less likely to identify as Republican, and are more likely to have never been married than GSS Mturk vs ANES MTurk sample has marginally more whites MTurk workers have significantly more education, are younger, have lower incomes, are more liberal, are less likely to identify as Republican, and are more likely to be living with a partner or to have never been married than ANES
Demographic Comparisons Qualtrics vs GSS The Qualtrics sample has marginally more males, and significantly more whites. Qualtrics respondents have more education, are younger, have lower income, are less politically moderate, are less likely to identify as Independent, and are more likely to never have been married than GSS Qualtrics vs ANES Qualtrics sample have significantly more education, are younger, have lower income, are more liberal, and are more likely to be living with a partner or to never have been married Qualtrics closer match on demographics
Should government make it easier or more difficult to buy guns? Should government do more to solve country s problems or should this be left to private businesses? ANES GSS MTURK MTURK QUALTRICS QUALTRICS
Is life exciting or dull? Science research should be supported by the federal government. GSS GSS MTURK MTURK QUALTRICS QUALTRICS
Do the poor have more or less money than they deserve? If certain groups stayed in their place, we would have fewer problems ANES ANES MTURK MTURK QUALTRICS QUALTRICS
Outcome Variable Distributions - Summary MTurk distributions differed significantly from ANES distributions on all four ANES variables Qualtrics differed significantly on three of the four variables MTurk distributions differed significantly from GSS on 19 of the 22 GSS variables Qualtrics significantly differed from GSS on 11 of the 22 variables
Bivariate Analysis Selected questions and demographics presented Use one category of outcome variables to make comparisons easier Illustrative rather than significance testing
Science makes our way of life change too fast (% strongly agree) Age 18 - 29 30 - 49 50-64 65+ GSS Mturk Qualtrics 8% 4% 7% 6% 22% 18% 12% 0% 13% 6% 5% 7% Gender Male Female 5% 6% 19% 18% 7% 8% Ideology Extremely Liberal Liberal Slightly Liberal Moderate 26% 8% 5% 5% 31% 15% 17% 19% 13% 9% 3% 7% Slightly Conservative 5% 23% 7% Conservative 5% 3% 7% Extremely Conservative 4% 19% 6%
People get ahead mostly through hard work, luck, or both equally?% hard work Age 18 - 29 30 - 49 50-64 65+ GSS Mturk Qualtrics 69% 73% 70% 64% 34% 43% 41% 29% 48% 48% 46% 43% Gender Male Female 66% 73% 43% 34% 47% 46% Ideology Extremely Liberal Liberal Slightly Liberal Moderate Slightly Conservative Conservative Extremely Conservative 52% 57% 65% 72% 74% 80% 76% 19% 35% 31% 48% 51% 73% 50% 49% 36% 40% 36% 53% 63% 68%
Should a woman be able to have an abortion for any reason?% yes Age 18 - 29 30 - 49 50-64 65+ GSS Mturk Qualtrics 48% 46% 48% 37% 83% 71% 63% 43% 69% 57% 53% 56% Gender Male Female 46% 44% 72% 78% 55% 62% Ideology Extremely Liberal Liberal Slightly Liberal Moderate Slightly Conservative Conservative Extremely Conservative 81% 69% 63% 43% 40% 21% 24% 95% 92% 79% 62% 54% 36% 13% 85% 79% 68% 62% 46% 41% 17%
Should the government do more to help the poor, or should people do more % people should do more Age 18 - 29 30 - 49 50-64 65+ GSS Mturk Qualtrics 7% 11% 12% 23% 6% 11% 13% 0% 8% 11% 13% 22% Gender Male Female 16% 11% 10% 8% 14% 12% Ideology Extremely Liberal Liberal Slightly Liberal Moderate Slightly Conservative Conservative Extremely Conservative 6% 4% 7% 10% 13% 28% 40% 5% 0% 4% 12% 17% 30% 50% 11% 4% 5% 9% 15% 19% 37%
Blacks should work their way up without special favors. % Strongly agree Age 18 - 29 30 - 49 50-64 65+ GSS Mturk Qualtrics 32% 37% 43% 39% 16% 20% 27% 0% 34% 36% 42% 48% Gender Male Female 39% 38% 18% 20% 41% 38% Ideology Extremely Liberal Liberal Slightly Liberal Moderate Slightly Conservative Conservative Extremely Conservative 32% 25% 24% 38% 39% 52% 70% 4% 6% 15% 21% 34% 45% 69% 43% 22% 17% 39% 44% 56% 64%
Bivariate Associations Summary Overall, the associations are what would be expected from previous research Substantial evidence of sample effects Qualtrics is relatively close to GSS Mturk is different from GSS
Multivariate Analysis Ordinal logistic regressions presented Mix of categorical and continuous variables Omitted categories are male, non-white, not South, married, Protestant, and Democrat Larger analysis uses logistic and multinomial regressions
OLR - Blacks should work their way up without special favors GSS (N=1480) MTurk (N=350) Qualtrics (N=512) Std. Error Std. Error Std. Error Gender Female Race White Education Age Region South Marital Status Widowed Divorced Separated Never married Family Income Religion Christian (non-Protestant) Other Political Ideology Party ID Republican Independent Other -0.151 (0.099) 0.037 0.214 -0.069 0.171 0.431*** -0.286*** 0.026 0.428* -0.052 0.068 (0.113) (0.043) (0.060) 0.375 -0.258* -0.368* 0.248 0.118 0.157 0.203 0.100 0.102 0.481*** (0.105) 0.018 0.213 -0.103 0.173 1.336* 0.307 -0.648 -0.190 0.037 -0.102 0.090 -0.313 -0.155 0.001 (0.201) (0.147) (0.287) (0.138) (0.027) -0.069 -0.078 -2.228* -0.389 0.127* 1.036 0.491 0.948 0.245 0.061 0.584 0.289 0.633 0.220 0.054 0.377** -0.269* 0.251*** 0.573** 0.234 0.245*** (0.119) (0.129) (0.042) -0.017 -0.170 0.680*** 0.337 0.320 0.096 0.217 0.241 0.063 0.496** 0.431*** 0.014 0.895** 0.513* -0.347 (0.156) (0.117) (0.290) -0.052 -0.030 0.595 0.433 0.268 0.470 0.263 0.221 0.353
OLR - How much of the time can you trust the federal government to do what is right? ANES (N=761) MTurk (N=350) Qualtrics (N=514) Std. Error Std. Error Std. Error Gender Female Race White Education Age Region South Marital Status Widowed Divorced Separated Never married Family Income Religion Christian (non-Protestant) Other Political Ideology Party ID Republican 0.376+ 0.106 0.208 0.414 0.270 0.215 0.551* 0.133 0.370** 0.066 0.069 0.261* 0.232 0.105 0.121 -0.051 0.114 0.049 0.301 0.146 0.199 0.237 0.124 0.129 0.010 0.213 -0.387 0.259 0.040 0.213 -0.350 -0.036 -0.154 0.649* 1.075+ 0.077 0.229** 0.392 0.326 0.725 0.318 0.581 0.063 0.075 0.054 -0.409 -1.537 -0.406 0.069 -0.059 -0.100 0.647 1.221 1.048 0.331 0.395 0.077 0.115 0.524 -1.184* -1.354+ 0.108 0.351 -0.165* 0.412*** 0.414 0.603 0.733 0.286 0.392 0.068 0.078 0.539+ 0.725** 1.302* 0.933+ 1.109** 1.716* 0.318 0.263 0.636 0.562 0.353 0.797 -0.451 0.010 -0.035 0.323 0.272 0.472
Regressions with sample type as variable Second step of analysis Samples pooled to allow sample type to be included as a variable Measures impact of sample type net of other variables Indicates the differences between nonprobability and probability samples
OLR - Blacks should work their way up without special favors with sample variable Std. Error Survey Type Qualtrics MTurk Family Income Marital Status Widowed Divorced Separated Never Married Age Female Region Midwest South West White Education Political Ideology Party ID Republican Independent Other 0.098 0.119 0.022 0.120 -0.665*** 0.020 0.183 0.125 0.247 0.103 0.048 0.078 0.029 0.094 -0.355 -0.245* 0.007 -0.095 0.120 0.112 0.121 0.090 0.037 0.031 -0.123 0.168 -0.111 0.308*** -0.262*** 0.329*** 0.544*** 0.368*** -0.051 0.126 0.094 0.199
OLR - Should birth control be available to teens without parental approval with sample variable Std. Error Survey Type Qualtrics MTurk Family Income Marital Status Widowed Divorced Separated Never Married Age Female Region Midwest South West White Education Political Ideology Party ID Republican Independent Other 0.097 0.123 0.022 -0.039 0.406*** 0.003 0.182 0.123 0.255 0.104 0.048 0.078 -0.166 0.168 0.466+ 0.161 -0.352*** 0.158* 0.124 0.113 0.124 0.091 0.038 0.031 -0.034 -0.156 0.253* 0.370*** 0.006 -0.374*** 0.125 0.095 0.212 -0.442*** -0.113 0.009
Regression Summary (tentative) Ordinal logistic regression - the outcome variables with basic demographics (age, race, etc.) For the most part, the variables performed as expected across the nonprobability and probability samples. The expected explanatory variables are in the right direction Qualtrics appears to be closer to probability samples than Mturk However, the relationships between basic demographic variables and outcome variables differ by sample type
Regression Summary (tentative) When the sample variable is introduced, the Mturk variable is significantly different, even when controlling for demographic variables A fuller analysis indicates that for some items, both Qualtrics and Mturk reasonably well but for many, the differences are substantial Mturk is generally further from the probability sample than Qualtrics
Summary (so far) The samples differ by demographic characteristics, including differences between ANES and GSS Mturk is younger, more educated, more male, and liberal than the other samples The Mturk differences are noted in the bivariate analysis The OLR models generally predict as expected but Mturk differs somewhat When the samples are combined, the Mturk sample has an independent effect in the model
Limitations Probability samples are much larger The analysis does not control for: Possible differences from 2013 - 2015 Mode effects for GSS Question order Limited analysis for this presentation, e.g., we think that samples are similar for some kinds of questions Random variation
Thank You! Contact Information: Elizabeth Zack Email: eszack@indiana.edu John Kennedy Email: kennedyj@indiana.edu
