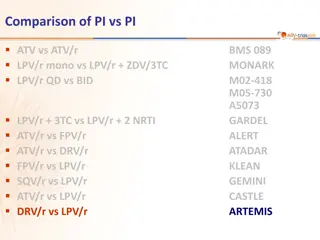
Comparison of Protease Inhibitors in HIV Treatment

This content discusses the comparison of various protease inhibitors (PIs) in HIV treatment, focusing on the efficacy and outcomes of different regimens. The GARDEL Study specifically compares LPV/r + 3TC versus LPV/r + 2 NRTI in terms of virologic response, patient characteristics, and treatment outcomes at week 48. The study aims to evaluate non-inferiority and assess virologic failure rates and resistance mutations.

Download Presentation

Please find below an Image/Link to download the presentation.
The content on the website is provided AS IS for your information and personal use only. It may not be sold, licensed, or shared on other websites without obtaining consent from the author.If you encounter any issues during the download, it is possible that the publisher has removed the file from their server.
You are allowed to download the files provided on this website for personal or commercial use, subject to the condition that they are used lawfully. All files are the property of their respective owners.
The content on the website is provided AS IS for your information and personal use only. It may not be sold, licensed, or shared on other websites without obtaining consent from the author.
E N D
Presentation Transcript
THERMOGRAM BREAST CANCER PREDICTION APPROACH BASED ON NEUTROSOPHIC SETS AND FUZZY C-MEANS ALGORITHM An application of Neutrosophic Sets for early detection of breast cancer Tarek Gaber, Gehad Ismail, Ahmed Anter, Mona Soliman, Mona Ali, Noura Semary, Aboul Ella Hassanien, Vaclav Snasel
Abstract. The early detection of breast cancer makes many women survive. With that aim, a CAD system classifying breast cancer thermograms to normal and abnormal is suggested. This approach consists of two main phases: automatic segmentation and classification. For the former phase, an improved segmentation approach based on both Neutrosophic sets (NS) and optimized Fast Fuzzy c-mean (F-FCM) algorithm is proposed. Also, post-segmentation process was suggested to segment breast parenchyma (i.e. ROI) from thermogram images. For the classification, different kernel functions of the Support Vector Machine (SVM) were used to classify breast parenchyma into normal or abnormal cases. Using benchmark database, the proposed CAD system was evaluated based on precision, recall, and accuracy as well as a comparison with related work. The experimental results showed that the system would be a very promising step toward automatic diagnosis of breast cancer using thermograms as the accuracy reached 100%.
I. INTRODUCTION. Breast cancer is the most common cancer among women in the world. In the USA, one death of women out of four is due to breast cancer [1]. [1] R.Siegel,J.Ma,Z.Zou,andA.Jemal, Cancer statistics,2014, CA: a cancer journal for clinicians,vol.64,no.1,pp.9 29,2014. Mammogram is one of the most imaging technology for diagnosing breast cancer. Although mammogram has recorded a high detection and classification accuracy, it is difficult in imaging dense breast tissues, its performance is poor in younger women and harmful, and it couldn t detect breast tumor that less than 2 mm [2]. [2] M. Milosevic, D. Jankovic, and A. Peulic, Comparative analysis of breast cancer detection in mammograms and thermograms, Biomedical Engineering/BiomedizinischeTechnik,vol.60,pp.49 56,2014.
I. INTRODUCTION cont. Infrared thermography (IRT) is used in production control as well as several fields of science like building diagnosis [3]. [3] A.Kylili,P.A.Fokaides,P.Christou,and S.A.Kalogirou, Infrared thermography (irt) applications for building diagnostics: A review, Applied Energy,vol.134,pp.531 549,2014. The main idea of IRT is that, it detects infrared light which is emitted by an object. For example, if the object is a person s body the IRT camera visualizes any changes in this body s heat caused by abnormalities in the blood flow existed in the surface of diseased areas [4]. [4] R. Gade and T. B. Moeslund, Thermal cameras and applications: a survey, Machine vision and applications, vol. 25, no. 1, pp. 245 262, 2014. IRT does not considered tool which illustrates anatomical abnormalities, but it is a method showing physiological changes. This method has been used for the first time for breast cancer started in [5] and has proved its accuracy for early detection, where tumor regions are usually higher in temperature than other regions. [5] R. Lawson, Implications of surface temperatures in the diagnosis of breast cancer, Canadian Medical Association Journal, vol. 75, no. 4, p.309,1956.
I. INTRODUCTION cont. Thermography is not better than mammography in terms of specificity but it is non-invasive functional imaging method which is harmless, passive, fast, and low cost [4]. [4] R. Gade and T. B. Moeslund, Thermal cameras and applications: a survey, Machine vision and applications, vol. 25, no. 1, pp. 245 262, 2014. In the early use of infrared images in the detection/diagnosis of the breast cancer [5], it faces many challenges such as poor calibrated equipment and low capability [5], [6]. [5] R. Lawson, Implications of surface temperatures in the diagnosis of breast cancer, Canadian Medical Association Journal, vol. 75, no. 4, p.309,1956. [6] S. A. Feig, G. S. Shaber, G. F. Schwartz, A. Patchefsky, H. I. Libshitz, J. Edeiken, R. Nerlinger, R. F. Curley, and J. D. Wallace, Thermography, mammography, and clinical examination in breast cancer screening: Review of 16,000 studies 1, Radiology, vol. 122, no.1,pp.123 127,1977. Later in the 90 s [7], it was reported that with the advances of the infrared imaging technology, IRT could be a good source of images to study and detect the cancer at the early stages. [7] J. Keyserlingk, P. Ahlgren, E. Yu, and N. Belliveau, Infrared imaging of the breast: Initial reappraisal using high-resolution digital technology in 100 successive cases of stage i and ii breast cancer, The Breast Journal,vol.4,no.4,pp.245 251,1998.
I. INTRODUCTION cont. Since then, crucial attentions have been directed to the thermal images again as a good mean to detect the breast cancer. The main advantage of IRT with breast cancer is that the early detection which is crucial for cancer patients for increasing the percentage of survival. Several Computer-Aided Detection(CAD) systems were proposed, e.g. [8], [9], [10], [11], [12]. [8] S. Suganthi and S. Ramakrishnan, Semi automatic segmentation of breast thermograms using variational level set method, in The 15th International Conference on Biomedical Engineering. Springer, 2014, pp.231 234. [9] U. R. Acharya, E. Y.-K. Ng, J.-H. Tan, and S. V. Sree, Thermography based breast cancer detection using texture features and support vector machine, Journal of medical systems, vol. 36, no. 3, pp. 1503 1510, 2012. [10] T. Jakubowska, B. Wiecek, M. Wysocki, C. Drews-Peszynski, and M. Strzelecki, Classification of breast thermal images using artificial neural networks, Journal of Medical Informatics & Technologies, vol.7,pp.41 50,2004. [11] S. V. Francis, M. Sasikala, and S. Saranya, Detection of breast abnormality from thermograms using curvelet transform based feature extraction, Journal of medical systems,vol.38,no.4,pp.1 9,2014. [12] B. Wiecek, M. Wiecek, R. Strakowski, T. Jakubowska, and E. Ng, Wavelet-based thermal image classification for breast screening and other medical applications, Ng EYK, Acharya RU, Suri JS. Performance Evaluation Techniques in Multimodality Breast Cancer Screening,Diagnosis andTreatment.American Scientific Publishers,2010.
I. INTRODUCTION cont. These systems can be manual, semi-automatic or fully automatic process [13]. [13] D.Machado,G.Giraldi,A.Novotny,R.Marques,and A.Conci, Topological derivative applied to automatic segmentation of frontal breast thermograms, 2013. Typically, CAD systems is initiated by segmenting thermogram image to obtain a region of interest (ROI), then some features are extracted and finallyclassification algorithms are used to classify the breast to normal or abnormal [8]. [8] S. Suganthi and S. Ramakrishnan, Semi automatic segmentation of breast thermograms using variational level set method, in The 15th International Conference on Biomedical Engineering. Springer, 2014, pp.231 234. For this purpose, different features have been tested. Texture features were used to detect abnormal thermograms using support vectormachine (SVM) [9] and artificia lneural networks [10]. [9] U. R. Acharya, E. Y.-K. Ng, J.-H. Tan, and S. V. Sree, Thermography based breast cancer detection using texture features and support vector machine, Journal of medical systems, vol. 36, no. 3, pp. 1503 1510, 2012. [10] T. Jakubowska, B. Wiecek, M. Wysocki, C. Drews-Peszynski, and M. Strzelecki, Classification of breast thermal images using artificial neural networks, Journal of Medical Informatics & Technologies, vol.7,pp.41 50,2004.
I. INTRODUCTION cont. Wiecek et al. [12] used features based on Discrete Wavelet Transform (DWT) with biorthogonal, Haar mother wavelets, and neural networks to classify thermograms. [12] B. Wiecek, M. Wiecek, R. Strakowski, T. Jakubowska, and E. Ng, Wavelet-based thermal image classification for breast screening and other medical applications, Ng EYK, Acharya RU, Suri JS. Performance Evaluation Techniques in Multimodality Breast Cancer Screening,Diagnosis andTreatment.American Scientific Publishers,2010. Here, it is presented an approach for automatic classification for thermogram to normal and abnormal. This approach consists of two main phases: (1) automatic segmentation done by Neutrosophic sets in conjunction with fuzzy c-means to get ROI; ( (2) classification achieved by extracting features, i.e. statistical, texture and energy, and then classified by SVM to into normal and abnormal.
I. INTRODUCTION cont. The proposed approach comparable with its related work, we will present previous efforts done using the PROENG database [14]. [14] L.Silva,D.Saade,G.Sequeiros,A.Silva,A.Paiva,R.Bravo,and A. Conci, A new database for breast research with infrared image, Journal of Medical Imaging and Health Informatics, vol. 4, no. 1, pp. 92 100,2014. These efforts can be classified into: automatic segmentation of breast regions [8], [15] and classification based on the asymmetry analysis to normal and abnormal cases [16], [17], [18]. [8] S. Suganthi and S. Ramakrishnan, Semi automatic segmentation of breast thermograms using variational level set method, in The 15th International Conference on Biomedical Engineering. Springer, 2014, pp.231 234. [15] S. S. Srinivasan and R. Swaminathan, Segmentation of breast tissues in infrared images using modified phase based level sets, in Biomedical Informatics and Technology. Springer, 2014, pp. 161 174. [16] S. Suganthi and S. Ramakrishnan, Analysis of breast thermograms using gabor wavelet anisotropy index, Journal of medical systems, vol.38,no.9,pp.1 7,2014. [17] S. Prabha, K. Anandh, C. Sujatha, and S. Ramakrishnan, Total variation based edge enhancement for level set segmentation and asymmetry analysis in breast thermograms, in Engineering in Medicine and Biology Society (EMBC), 2014 36th Annual International Conference of the IEEE. IEEE, 2014, pp. 6438 6441. [18] E. Rodrigues, A. Conci, T. Borchartt, A. Paiva, A. C. Silva, and T. MacHenry, Comparing results of thermographic images based diagnosis for breast diseases, in Systems, Signals and Image Processing (IWSSIP), 2014 International Conference on. IEEE, 2014, pp. 39 42.
I. INTRODUCTION cont. For the automatic segmentation, the level set technique has been used to extract the blood vessels in a thermal image. The Level set function was evolved using the gradient magnitude and direction of an edge map provided by few initial points selected in region of interest. In [8], an automatic segmentation approach, using active contour and level set method without re-initialization, was proposed to extract the breast regions from breast thermograms. [8] S. Suganthi and S. Ramakrishnan, Semi automatic segmentation of breast thermograms using variational level set method, in The 15th International Conference on Biomedical Engineering. Springer, 2014, pp.231 234. Before applying the level set, a statistical based noise removal technique and contrast limited adaptive histogram equalization were used to improve signal to noise ratio and contrast of thermal images. Verification and validation of the segmented results were carried out using 60 images against the ground truths. The segmented areas were observed to be in good correlation with the ground truth areas as the correlation coefficient was 98%.
I. INTRODUCTION cont. Another automatic segmentation approach has been proposed in [15] to segment the frontal breast tissues from breast thermograms. [15] S. S. Srinivasan and R. Swaminathan, Segmentation of breast tissues in infrared images using modified phase based level sets, in Biomedical Informatics and Technology. Springer, 2014, pp. 161 174. This approach made use of the Modified Phase Based Distance Regularized Level Set (MPBDRLS) method. The method was further modified by adopting an improved diffusion rate model. The segmented region of interests was evaluated using 72 gray scale images of size 320 x 240 pixels and against the ground truth images. The overlap measures showed that the average similarity between four sets ground truths and segmented region of interests was 97%.
I. INTRODUCTION cont. The asymmetric-based classification is based on the asymmetric abnormalities which can be identified by comparing the features extracted from the breast regions (right and left). Several statistical and fractal features are found to be useful features in identification of pathological conditions of breast tissues [18]. [18] E. Rodrigues, A. Conci, T. Borchartt, A. Paiva, A. C. Silva, and T. MacHenry, Comparing results of thermographic images based diagnosis for breast diseases, in Systems, Signals and Image Processing (IWSSIP), 2014 International Conference on. IEEE, 2014, pp. 39 42. Using PROENG database, in [16], an approach was proposed to classify the normal and abnormal (carcinoma, nodule and fibro adenoma) breast thermograms Gabor wavelet transform. [16] S. Suganthi and S. Ramakrishnan, Analysis of breast thermograms using gabor wavelet anisotropy index, Journal of medical systems, vol.38,no.9,pp.1 7,2014. First, the segmentation of the breast tissues was performed using ground truth masks and the raw images. Gabor features were then extracted for the detection of the abnormalities. The results showed that from total of 20 images, used of the approach evaluation, there were 9 images with carcinomas, 6 with nodules, and 5 with fibro adenomas.
I. INTRODUCTION cont. In [17], another asymmetry analysis for breast thermograms was proposed using non-linear total variation diffusion filter and reaction diffusion based level set method. Initially the images were subjected to total variation (TV) diffusion filter to generate the edge map. [17] S. Prabha, K. Anandh, C. Sujatha, and S. Ramakrishnan, Total variation based edge enhancement for level set segmentation and asymmetry analysis in breast thermograms, in Engineering in Medicine and Biology Society (EMBC), 2014 36th Annual International Conference of the IEEE. IEEE, 2014, pp. 6438 6441. Reaction diffusion based level set method was then employed to segment the breast tissues using TV edge map as stopping boundary function. Asymmetry analysis is then performed on the segmented breast tissues using wavelet based structural texture features. The evaluation of this approach was done using 20 images that have pathologies either in left or right region. The results of this approach showed that the segmented area of TV based level set is correlated with the ground truth with 99%.
I. INTRODUCTION cont. FCM and Fast-FCM [20] has been applied and proven to be good for image segmentation as they retain more information than that of the hard segmentation methods. [20] A.-R.Ali,M.S.Couceiro,A.M.Anter,and A.E.Hassanian, Evaluating an evolutionary particle swarm optimization for fast fuzzy c- means clustering on liver ct images, Computer Vision and Image Processing in Intelligent Systems and Multimedia Technologies, p. 1, 2014. However, as reported in [21] the indeterminacy of each element in the FCM and F-FCM could not be evaluated and described and in some applications, e.g, expert system, the indeterminacy should be considered. [21] A.M.Anter,A.E.Hassanien,M.A.A.ElSoud,and M.F.Tolba, Neutrosophic sets and fuzzy c-means clustering for improving ct liver image segmentation, in In Bio-Inspired Computing and Applications IBICA 2014,vol.303.Springer,2014,pp.193 203. Neutrosophic sets (NS) can be used to address this problem. NS introduces a new component called indeterminacy which carries more information than fuzzy sets do [22]. [22] F. Smarandache, A Unifying Field in Logics: Neutrosophic Logic. Neutrosophy, Neutrosophic Set, Neutrosophic Probability: Neutrosophic Logic. Neutrosophy, Neutrosophic Set, Neutrosophic Probability. Infinite Study,2005.
I. INTRODUCTION cont. Therefore, applying the Neutrosophic sets based on F-FCM (NS-FFCM) algorithm to the segmentation process of thermal breast cancer images may allow achieving both vital important goals at once. Figure 1b next slide illustrates the effect of NS comparing to F-FCM only. FIGURE 1a: Stages of the proposed CAD system.
I. INTRODUCTION cont. FIGURE 1b: FFCM vs NS-FFCM.
II. THE PROPOSED CAD SYSTEM. The proposed CAD system for thermogram images consists of six steps which are explained below. 1. Thermogram image transformation: Thermogram images are firstly pre-processed using median filter to remove any noise, resulted in by defects of the IRT camera [23]. [23] A. M. Anter, A. T. Azar, A. E. Hassanien, N. El-Bendary, and M. A. ElSoud, Automatic computer aided segmentation for liver and hepatic lesions using hybrid segmentations techniques, in In the Proceeding of FedCSIS 2013. IEEE, 2013, pp. 193 198. Then, as illustrated in Algorithm 1 next slide, the images were transformed to neutrosophic domain to reduce the indeterminacy degree of the image, which is evaluated by the entropy of the indeterminate subset. Then, the image becomes more uniform and homogenous, and more suitable for segmentation.
II. THE PROPOSED CAD SYSTEM cont. ALGORITHM 1: Neutrosophic sets transformation approach.
II. THE PROPOSED CAD SYSTEM cont. 2-3-4. Pre-, segmentation and Post-segmentation: Presegmentation processes are done by decreasing the indeterminacy set and removing the noise. The image became more uniform, homogenous, and more suitable for clustering using optimized F-FCM which was applied to cluster the thermal NS image to three clusters: red background, blue for body tissue, and green for the breast tissue, see Figure 2 next slide. To obtain F-FCM rather than FCM, the histogram of the image intensities is used during the clustering process instead of the raw image data to increase the computation efficiency.
II. THE PROPOSED CAD SYSTEM cont. FIGURE 2: Results of clustering thermal image using NS sets and F-FCM. Post-segmentation algorithms, as explained in Algorithm 2 next slide, were used to enhance the segmentation results and remove non-ROI.
II. THE PROPOSED CAD SYSTEM cont. ALGORITHM 1I: Pre and post segmentation process.
II. THE PROPOSED CAD SYSTEM cont. FIGURE 3: Steps of the Post-segmentation algorithm to detect and segment abnormal breast parenchyma from thermal NSFFCM image.
II. THE PROPOSED CAD SYSTEM cont. 5. Feature Extraction: A number of feature extraction techniques, GLCM, Gabor filter, and first statistics, were applied to the segmented image. 30-features were extracted: 22 from GLCM [11], 3 from absolute Gabor coefficients [16], and 5 from first order statistics. [11] S. V. Francis, M. Sasikala, and S. Saranya, Detection of breast abnormality from thermograms using curvelet transform based feature extraction, Journal of medical systems, vol. 38, no. 4, pp. 1 9, 2014. [16] S. Suganthi and S. Ramakrishnan, Analysis of breast thermograms using gabor wavelet anisotropy index, Journal of medical systems, vol.38,no.9,pp.1 7,2014. 6. Classification Phase: To classify the extracted features, the SVM classifier was used. It is a supervised learning method that transforms input data to high-dimensional feature space though different kernel functions: e.g. Linear, polynomial, RBF, and quadratic [24]. [24] H. Xu, C. Caramanis, and S. Mannor, Robustness and regularization of support vector machines, The Journal of Machine Learning Research, vol. 10, pp. 1485 1510, 2009.
III. EXPERIMENTAL RESULTS AND DISCUSSION. A benchmark database [14] was used to evaluate the proposed approach. [14] L.Silva,D.Saade,G.Sequeiros,A.Silva,A.Paiva,R.Bravo,and A. Conci, A new database for breast research with infrared image, Journal of Medical Imaging and Health Informatics, vol. 4, no. 1, pp. 92 100,2014. It contains 149 patients with images at size of 640480 pixels. The frontal images are selected to test the proposed CAD system. 63 cases, 29 healthy and 34 malignant, are used. In order to prove the robustness of the proposed system, as illustrated in Table I next slide, four scenarios were employed to evaluate using the SVM classifier. They were designed to understand the stability of the proposed system under different conditions.
III. EXPERIMENTAL RESULTS AND DISCUSSION cont. TABLE I: Different scenarios for training and testing the system. As shown from next Tables (II, III, and IV), it can be noticed that: (1) the more training images were used, the high accuracy was obtained as the case of the 4th scenario reaching 100%; (2) the RBF-SVM classifier gave the best results for classifying thermogram images.
III. EXPERIMENTAL RESULTS AND DISCUSSION cont. TABLE II: The precision evaluation of the results. The results of the four scenarios using SVM kernel functions (linear, RBF, Polynomial, and Quadratic) are summarized in Figure 4 next slide.
III. EXPERIMENTAL RESULTS AND DISCUSSION cont. FIGURE 4: The accuracy of the SVM classifier using different kernel functions for the 4 scenarios.
III. EXPERIMENTAL RESULTS AND DISCUSSION cont. In addition to the accuracy evaluation, it was used, as demonstrated in Tabled II, III, and IV next slides, the Precision, Recall, and Error rate respectively, for the results evaluation. Further evaluation, as seen in Figure 5 next slide, was done using the leave one-out approach. Comparing with the related work in [16], [17], [18], our proposed system achieved better accuracy, reaching 100 %, while using a higher number of images for testing and training. This is due to the automatic extraction and enhancement of the ROI. [16] S. Suganthi and S. Ramakrishnan, Analysis of breast thermograms using gabor wavelet anisotropy index, Journal of medical systems, vol.38,no.9,pp.1 7,2014. [17] S. Prabha, K. Anandh, C. Sujatha, and S. Ramakrishnan, Total variation based edge enhancement for level set segmentation and asymmetry analysis in breast thermograms, in Engineering in Medicine and Biology Society (EMBC), 2014 36th Annual International Conference of the IEEE. IEEE, 2014, pp. 6438 6441. [18] E. Rodrigues, A. Conci, T. Borchartt, A. Paiva, A. C. Silva, and T. MacHenry, Comparing results of thermographic images based diagnosis for breast diseases, in Systems, Signals and Image Processing (IWSSIP), 2014 International Conference on. IEEE, 2014, pp. 39 42.
III. EXPERIMENTAL RESULTS AND DISCUSSION cont. FIGURE 5: Results of the Leave-One-Out Cross-Validation Method.
III. EXPERIMENTAL RESULTS AND DISCUSSION cont. TABLE III: The Recall evaluation of the results. TABLE IV: The error rate evaluation of the results.
CONCLUSION. A CAD system for thermogram breast images was proposed. The system first extracted ROI using Neutrosophic Set, FFCM and morphological operators. It then used several features (statistical, texture and energy) with the SVM to detected normal and abnormal breast. Using a benchmark database, the proposed system was evaluated through recall, accuracy, precision, and error rate showing that our CAD system achieving an excellent results. Also, it was found that NS sets with F-FCM is an effective segmentation method for thermogram images as NS enhanced thermal image and reduced the indeterminacy. In the future, there are plans to evaluate this system using a large size of the dataset to test its reliability.
REFERENCES [1] R.Siegel,J.Ma,Z.Zou,andA.Jemal, Cancer statistics, 2014, CA: a cancer journal for clinicians,vol.64,no.1,pp.9 29,2014. [2] M. Milosevic, D. Jankovic, and A. Peulic, Comparative analysis of breast cancer detection in mammograms and thermograms, Biomedical Engineering/BiomedizinischeTechnik,vol.60,pp.49 56,2014. [3] A.Kylili, P.A.Fokaides,P.Christou,and S.A.Kalogirou, Infrared thermography (irt) applications for building diagnostics: A review, Applied Energy,vol.134,pp.531 549,2014. [4] R. Gade and T. B. Moeslund, Thermal cameras and applications: a survey, Machine vision and applications, vol. 25, no. 1, pp. 245 262, 2014. [5] R. Lawson, Implications of surface temperatures in the diagnosis of breast cancer, Canadian Medical Association Journal, vol. 75, no. 4, p.309,1956. [6] S. A. Feig, G. S. Shaber, G. F. Schwartz, A. Patchefsky, H. I. Libshitz, J. Edeiken, R. Nerlinger, R. F. Curley, and J. D. Wallace, Thermography, mammography, and clinical examination in breast cancer screening: Review of 16,000 studies 1, Radiology, vol. 122, no.1,pp.123 127,1977. [7] J. Keyserlingk, P. Ahlgren, E. Yu, and N. Belliveau, Infrared imaging of the breast: Initial reappraisal using high-resolution digital technology in 100 successive cases of stage i and ii breast cancer, The Breast Journal,vol.4,no.4,pp.245 251,1998. [8] S. Suganthi and S. Ramakrishnan, Semi automatic segmentation of breast thermograms using variational level set method, in The 15th International Conference on Biomedical Engineering. Springer, 2014, pp.231 234. [9] U. R. Acharya, E. Y.-K. Ng, J.-H. Tan, and S. V. Sree, Thermography based breast cancer detection using texture features and support vector machine, Journal of medical systems, vol. 36, no. 3, pp. 1503 1510, 2012. [10] T.Jakubowska,B.Wiecek,M.Wysocki,C.Drews-Peszynski,and M. Strzelecki, Classification of breast thermal images using artificial neural networks, Journal of Medical Informatics & Technologies, vol.7,pp.41 50,2004.
REFERENCES cont. [11] S. V. Francis, M. Sasikala, and S. Saranya, Detection of breast abnormality from thermograms using curvelet transform based feature extraction, Journal of medical systems, vol. 38, no. 4, pp. 1 9, 2014. [12] B. Wiecek, M. Wiecek, R. Strakowski, T. Jakubowska, and E. Ng, Wavelet-based thermal image classification for breast screening and other medical applications, Ng EYK, Acharya RU, Suri JS. Performance Evaluation Techniques in Multimodality Breast Cancer Screening, Diagnosis and Treatment. American Scientific Publishers, 2010. [13] D.Machado,G.Giraldi,A.Novotny,R.Marques,and A.Conci, Topological derivative applied to automatic segmentation of frontal breast thermograms, 2013. [14] L. Silva, D. Saade, G. Sequeiros, A. Silva, A. Paiva, R. Bravo, and A. Conci, A new database for breast research with infrared image, Journal of Medical Imaging and Health Informatics, vol. 4, no. 1, pp. 92 100,2014. [15] S. S. Srinivasan and R. Swaminathan, Segmentation of breast tissues in infrared images using modified phase based level sets, in Biomedical Informatics and Technology. Springer, 2014, pp. 161 174. [16] S. Suganthi and S. Ramakrishnan, Analysis of breast thermograms using gabor wavelet anisotropy index, Journal of medical systems, vol.38,no.9,pp.1 7,2014. [17] S. Prabha, K. Anandh, C. Sujatha, and S. Ramakrishnan, Total variation based edge enhancement for level set segmentation and asymmetry analysis in breast thermograms, in Engineering in Medicine and Biology Society (EMBC), 2014 36th Annual International Conference of the IEEE. IEEE, 2014, pp. 6438 6441. [18] E. Rodrigues, A. Conci, T. Borchartt, A. Paiva, A. C. Silva, and T. MacHenry, Comparing results of thermographic images based diagnosis for breast diseases, in Systems, Signals and Image Processing (IWSSIP), 2014 International Conference on. IEEE, 2014, pp. 39 42.
REFERENCES cont. [19] Q. Zhou, Z. Li, and J. K. Aggarwal, Boundary extraction in thermal images by edge map, in Proceedings of the 2004 ACM symposium on Applied computing. ACM, 2004, pp. 254 258. [20] A.-R.Ali,M. S. Couceiro,A.M. Anter,and A.E.Hassanian, Evaluating an evolutionary particle swarm optimization for fast fuzzy c- means clustering on liver ct images, Computer Vision and Image Processing in Intelligent Systems and Multimedia Technologies, p. 1, 2014. [21] A.M.Anter,A.E.Hassanien,M.A.A.ElSoud,and M.F.Tolba, Neutrosophic sets and fuzzy c-means clustering for improving ct liver image segmentation, in In Bio-Inspired Computing and Applications IBICA 2014,vol. 303.Springer,2014,pp.193 203. [22] F. Smarandache, A Unifying Field in Logics: Neutrosophic Logic. Neutrosophy, Neutrosophic Set, Neutrosophic Probability: Neutrosophic Logic. Neutrosophy, Neutrosophic Set, Neutrosophic Probability. Infinite Study,2005. [23] A. M. Anter, A. T. Azar, A. E. Hassanien, N. El-Bendary, and M. A. ElSoud, Automatic computer aided segmentation for liver and hepatic lesions using hybrid segmentations techniques, in In the Proceeding of FedCSIS 2013. IEEE, 2013, pp. 193 198. [24] H. Xu, C. Caramanis, and S. Mannor, Robustness and regularization of support vector machines, The Journal of Machine Learning Research, vol. 10, pp. 1485 1510, 2009.