Comparison of Visceral and Subcutaneous Adipose Tissue Measurements
Bland-Altman plots show intra- and inter-operator agreement for visceral adipose tissue (VAT) and subcutaneous adipose tissue (SAT) measurements. The plots display mean differences and limits of agreement for VAT and SAT areas, comparing readings by one operator and two different operators separately. The analysis highlights the consistency and variability in adiposity measurements, crucial for accurate assessment in research and clinical settings.

Download Presentation

Please find below an Image/Link to download the presentation.
The content on the website is provided AS IS for your information and personal use only. It may not be sold, licensed, or shared on other websites without obtaining consent from the author.If you encounter any issues during the download, it is possible that the publisher has removed the file from their server.
You are allowed to download the files provided on this website for personal or commercial use, subject to the condition that they are used lawfully. All files are the property of their respective owners.
The content on the website is provided AS IS for your information and personal use only. It may not be sold, licensed, or shared on other websites without obtaining consent from the author.
E N D
Presentation Transcript
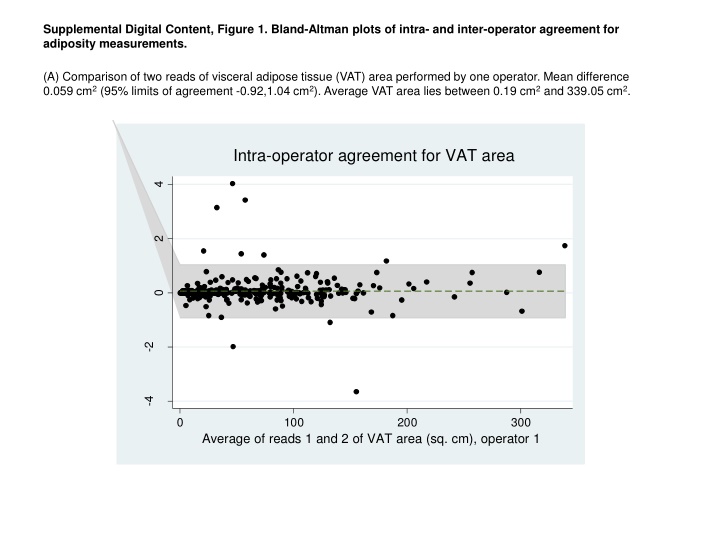
Supplemental Digital Content, Figure 1. Bland-Altman plots of intra- and inter-operator agreement for adiposity measurements. (A) Comparison of two reads of visceral adipose tissue (VAT) area performed by one operator. Mean difference 0.059 cm2 (95% limits of agreement -0.92,1.04 cm2). Average VAT area lies between 0.19 cm2 and 339.05 cm2. Intra-operator agreement for VAT area 4 Difference in sq. cm (read 1 - read 2) 2 0 -2 -4 0 100 200 300 Average of reads 1 and 2 of VAT area (sq. cm), operator 1
Supplemental Digital Content, Figure 1 (continued). Bland-Altman plots of intra- and inter-operator agreement for adiposity measurements. (B) Comparison of reads of visceral adipose tissue (VAT) area performed by two different operators. Mean difference 0.14 cm2 (95% limits of agreement -0.93, 1.22 cm2). Average VAT area lies between 0.19 cm2 and 338.80 cm2. Inter-operator agreement for VAT area Difference in sq. cm (operator 1 - operator 2) 4 2 0 -2 0 100 200 300 Average of reads of VAT area (sq. cm) by operators 1 and 2
Supplemental Digital Content, Figure 1 (continued). Bland-Altman plots of intra- and inter-operator agreement for adiposity measurements. (C) Comparison of two reads of subcutaneous adipose tissue (SAT) area performed by one operator. Mean difference -0.059 cm2 (95% limits of agreement -1.04, 0.92 cm2). Average SAT area lies between 0.08 cm2 and 861.84 cm2. Intra-operator agreement for SAT area 4 Difference in sq. cm (read 1 - read 2) 2 0 -2 -4 0 150 300 450 600 750 900 Average of reads 1 and 2 of SAT area (sq. cm), operator 1
Supplemental Digital Content, Figure 1 (continued). Bland-Altman plots of intra- and inter-operator agreement for adiposity measurements. (D) Comparison of reads of subcutaneous adipose tissue (SAT) area performed by two different operators. Mean difference -0.11 cm2 (95% limits of agreement -1.90, 1.68 cm2). Average SAT area lies between 0.08 cm2 and 863.10 cm2. Inter-operator agreement for SAT area 15 Difference (operator 1 - operator 2) 10 5 0 -5 0 150 300 450 600 750 900 Average of reads of SAT area (sq. cm) by operators 1 and 2

.")
.")
.")