Comparisons of Helium and Hydrogen Releases in Enclosures: Experimental Findings
Explore the comprehensive comparison of helium and hydrogen releases in 1m3 and 2m3 enclosures, analyzing concentration measurements at varying flow rates and nozzle sizes. The study delves into geometry, sensor technologies, experimental processes, reproducibility results, and modeling approaches for understanding gas release behaviors.

Download Presentation

Please find below an Image/Link to download the presentation.
The content on the website is provided AS IS for your information and personal use only. It may not be sold, licensed, or shared on other websites without obtaining consent from the author. If you encounter any issues during the download, it is possible that the publisher has removed the file from their server.
You are allowed to download the files provided on this website for personal or commercial use, subject to the condition that they are used lawfully. All files are the property of their respective owners.
The content on the website is provided AS IS for your information and personal use only. It may not be sold, licensed, or shared on other websites without obtaining consent from the author.
E N D
Presentation Transcript
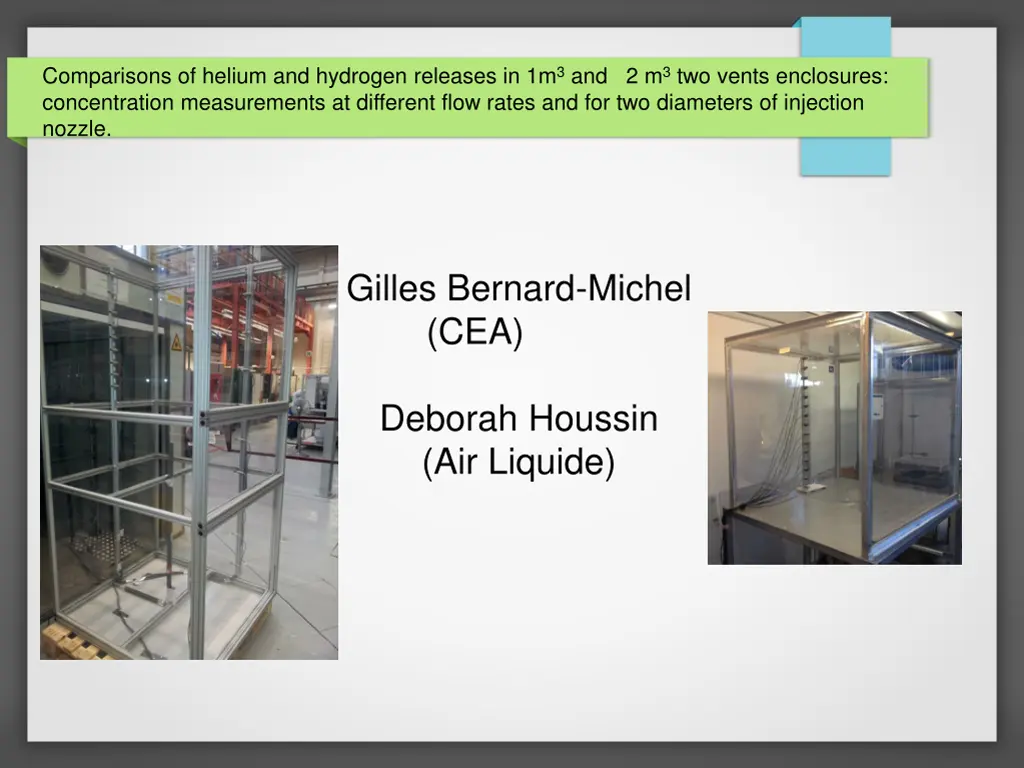
Comparisons of helium and hydrogen releases in 1m3 and 2 m3 two vents enclosures: concentration measurements at different flow rates and for two diameters of injection nozzle. Gilles Bernard-Michel (CEA) Deborah Houssin (Air Liquide)
Geometry: 2 vents cavities 2 m3 cavity: - 2.10 m height - 1mx1m base - top and bottom vent of 19cmx98cm 1 m3 cavity: - 1 m height - 0.995mx0.995m base - top and bottom vent of 18cmx96cm
Sensors Xensor TCG3880 catharometres: -15 sensors - Calibrated for he and h2 - Regular spacing 15 Sensors 12 cm 15 Sensors 6.5 cm 95 cm Injection 28 cm 20.4 cm Injection 8 cm
Varying parameters Experiments, C measurements: 2 different enclosures (1m3and 2m3) 2 different injection nozzle (4 mm, 27.2 mm) Flow rates from 5Nl/min up to 210 Nl/min 2 gas: He and H2 From plume to jet: - Richardson number 5.77 107down to 7.08 10-4
Experimental process Reproducibility: - Tests performed at INERIS, AL and CEA (different facilities) - 2 differents sets of sensors for some of the tests - Series of tests at INERIS - Different flowmeters used Heliumvolume fraction (%) - Instantaneousheliumconcentration - Sampleatsteady state for mean calculation - Calculated mean Stationnary state: -Only stationnay data are used - long enough gas injections (approx 10 min) Time averaged concentrations: Time (min) Errors less than 0.3% absolute concentration - Mainly calibration
Reproducibility results with he -2locations: INERIS and CEA - Ambient temperature of 11 C (INERIS) and 20 C (CEA) - Almost no air circulation - Humidity of 100% (INERIS) and 55%(CEA) - 2 sets of sensor (AL and CEA) Exp. I Exp. II Exp. III Diameter Flow rate Cmax Cmax Cmax - 2 different calibrated flowmeters (CEA and AL) mm NL/min %vol %vol %vol 27 210 6.6 6.5 6.7 27 70 2.81 2.9 3.1 27 20 1.34 1.4 1.3 27 5 0.68 0.55 0.6
Model and scaling Enclosure Linden model: Air + Gas Ht - 2 homogenous layers Top vent - 1D distribution outside the jet Homogeneous layer - pure air layer at the bottom H - concentration depends on distance between injection and top vent h Bottomvent Hb Air Gas release Scaling:
Hydrogen versus helium comparisons on 2-m3 enclosure Diam flow rate he Cmaxhe Cmaxh2 mm %vol %vol NL/min 27 5 0.68 1,06 4 5 0.88 1.09 27 20 1.34 1.83 4 20 1.41 1.73 27 70 2.81 3.35 4 70 2.74 3.3 27 210 6.6 6.17 4 210 4,69 5,44
Hydrogen versus helium comparisons on 1-m3 enclosure Injection flow rate Cmaxhe Cmaxh2 (mm) 27 NL/min 10 %vol 1,79 %vol 1.80 4 10 1.97 2.04 27 20 - 2.52 4 20 2.76 3.0 27 60 - 5.03 4 60 4.35 4.99 27 100 8.23 6.69 4 100 4.84 6.15 27 210 - 11.12 4 210 - 7.38
First observations Injection diameter: Smaller injection diameter => smaller maximum concentration at higher flow rates injection diameter has few influence for plumes regimes. Gas effect: similar behavior for plumes regimes for he and H2 with slightly higher concentrations for h2. larger spreading of maximum he concentration vs diameter than for h2. => For large injection diameter, max he concentration > max h2 concentration => For small injection diameter, max h2 concentration > max he concentration Similitude law has to be improved => Based on flow rates and another parameter (diameter?, )
Some first explanations ? Similitude law requires same Interface s height We observe different interfaces heights for he and h2. The sensitive parameter in Linden s model is the mixing Length. We need to have a closer look at this (models are based on different definitions of reduced gravity)


