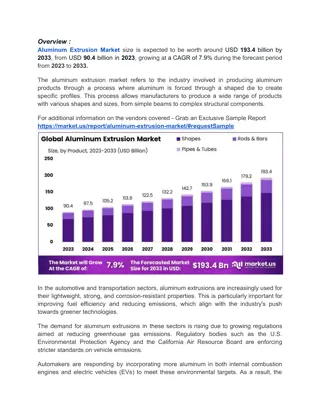
Comprehensive Guide to Time Series Analysis for Forecasting
Delve into time series analysis for forecasting, focusing on autoregressive models, estimation steps, and the use of tools like Simetar to simplify the forecasting process. Learn about univariate distributions, regression modeling, stationarity testing, lag determination, and more in this detailed overview. Enhance your understanding of forecasting methodologies and improve your forecasting accuracy with this informative resource.

Download Presentation

Please find below an Image/Link to download the presentation.
The content on the website is provided AS IS for your information and personal use only. It may not be sold, licensed, or shared on other websites without obtaining consent from the author. If you encounter any issues during the download, it is possible that the publisher has removed the file from their server.
You are allowed to download the files provided on this website for personal or commercial use, subject to the condition that they are used lawfully. All files are the property of their respective owners.
The content on the website is provided AS IS for your information and personal use only. It may not be sold, licensed, or shared on other websites without obtaining consent from the author.
E N D
Presentation Transcript
Time Series Analysis Lecture 11 Materials for this lecture Lecture 11 Lags.XLSX Lecture 11 Stationarity.XLSX Read Chapter 15 pages 30-37 Read Chapter 16 Section 15
Time Series Analysis Again this section of the course is supposed to be a review of AGEXC 621 Time Series forecasting was covered in 621 It is included here to reinforce the topic Simetar was programmed to make time series forecasting much easier as we can focus on the application instead of the process
Time Series Analysis Time series amounts to forecasting a variable using only on its past values This is called an autoregressive model We are going to focus on the application and less on the estimation calculations because they are just simply OLS Simetar estimates TS models easily with a menu and provides forecasts of the time series model
Time Series Analysis TS is a comprehensive forecasting methodology for univariate distributions Best for variables unrelated to other variables in a structural model Autoregressive process in the simplest form is a regression model such as: t= f(Yt-1, Yt-2, Yt-3, Yt-4, ) Notice there are no structural variables, just lags of the variable itself
Time Series Analysis Steps for estimating a times series model are: Graph the data series to see what patterns are present trend, cycle, seasonal, and random Test data for Stationarity with a Dickie Fuller (D-F) Test If original series is not stationary then difference it until it is Number of Differences (p) to make a series stationary is determined using the D-F Test Use the stationary (differenced) data series to determine the number of Lags that best forecasts the historical period Given a stationary series, use the Schwarz Criteria (SIC) or autocorrelation table to determine the best number of lags (q) to include when estimating the model Estimate the AR(p,q) Model with OLS and make a forecast using the Chain Rule
Two Time Series Analysis Assumptions Assume series you are forecasting is really random No trend, seasonal, or cyclical pattern remains in series Series is stationary or white noise To guarantee this assumption we must make the data stationary Assume the variability is constant, i.e., the same for the future as for the past, in other words 2T+i = 2Historically Can test for constant variance by testing correlation over time This is a crucial assumption because if 2 changes overtime, then forecast will explode overtime
First Make the Data Series Stationary Take differences of the data to make it stationary First difference of raw data in Y to calculate D1,t D1,t= Yt Yt-1 Calculate the Second Difference of Y using the first difference (D1,t ) or D2,t= D1,t D1,t-1 Calculate the Third Difference of Y using the second difference (D2,t) or D3,t = D2,t D2,t-1 Stop differencing data when series is stationary
Make Data Series Stationary Example Difference table for a time series data set D1tin period 1 is 0.41= 71.47 71.06 D1tin period 2 is -1.41= 70.06 71.47 D2tin period 1 is -1.82 = -1.41 0.41 D2tin period 2 is 1.66 = 0.25 ( 1.41) Etc.
Make Data Series Stationary Example Difference table for a time series data set D1tin period 1 is 0.41= 71.47 71.06 D1tin period 2 is -1.41= 70.06 71.47 D2tin period 1 is -1.82 = -1.41 0.41 D2tin period 2 is 1.66 = 0.25 ( 1.41) Etc.
Test for Stationarity Dickie-Fuller Test for stationarity First D-F test First is original data stationary? Estimate regression = a + b D1,t Calculate the t-ratio for b to see if a significant slope exists. D-F Test statistic is the t-statistic; if more negative than -2.9, we declare the dependent series ( in this case) stationary at alpha 0.05 level (-2.90 is a 1 tailed t test critical value) Thus a D-F statistic of -3.0 is more negative than -2.90 so the original series is stationary and differencing is not necessary
Next Level of Testing for Stationarity Second D-F Test for stationarity of the D1,tseries, in other words Here we are testing if the Y series will be stationary after only one differencing? So we are asking if the D1,tseries is stationary Estimate regression for D1,t= a + b D2,t t-statistic on slope b is the second D-F test statistic Is the statistic more negative than -2.90?
Next Level of Testing for Stationarity Third D-F Test for stationarity of the D2,tseries In other words will the Y series be stationary with two differences? So we are testing if D2,tis stationary Estimate regression for D2,t= a + b D3,t t-statistic on slope b is the third D-F test statistic Continue with a fourth and fifth DF test if necessary
Test for Stationarity How does D-F test work? A series is stationary, if it oscillates about the mean and has a slope of zero 0 = D1,t 0 = D1,t t = 1, 2 . . . . . . . . T t = 1, 2 . . . . . . . . T If a 1 period lag Yt-1is used to predict Yt, they are good predictors of each other because they have the same mean. The t-statistic on b will be significant for D1,t= a + b D2,t Lagging the data 1 period causes the two series to be inversely related so the slope is negative in the OLS equation. That explains why the t coefficient of -2.9 is negative. The -2.9 represents a 5% 1 tail test statistic.
Test for Stationarity Estimated regression for: t = a + b D1,t DF is -1.868. You can see it is the t statistic for the beta on D1 See a trend in original data and no trend in the residuals Intercept not zero so mean of Y is not constant
Test for Stationarity Estimated regression for:D1,t = a + b D2,t DF is -12.948, which is the t ratio on the slope parameter b See the residuals oscillate about a mean of zero, no trend in either series Intercept is 0.121 or about zero, so the mean is more likely to be constant
Test for Stationarity Estimated regression for:D2,t = a + b D3,t DF is -24.967 the t ratio on the slope variable Intercept is about zero
DF Stationarity Test in Simetar Dickie Fuller (DF) function in Simetar =DF ( Data Series, Trend, No Lags, No. Diff to Test) Where: Data series is the location of the data, Trend is True or False for Augmented DF test No. Lags is set to ZERO, always No. Diff is the number of differences to test
Test for Stationarity Number of differences that make the data series stationary is the one that has a DF test statistic more negative than -2.9 Here it is 1 difference no matter if trend included or not Lecture 5
Summarize Stationarity Yt is the original data series Di,t is the ith difference of the Yt series We difference the data to make it stationary To guarantee the assumption that the mean is constant Dickie Fuller test in Simetar to determine the no. of differences needed to make series stationary =DF(Data, Trend, 0 , No. of Differences) Test 0 to 6 differences with and without trend and zero lags using =DF() Select the number of differences with a DF test statistic more negative than -2.90
NEXT, Must Determine the Number of Lags Once we have determined the number of differences (p) we know what form the auto regressive (AR) model will be fit AR ( No. Differences, No. Lags) or AR(p,q) If the series is stationary with 1 difference, estimate the OLS model D1,t = a + b1 D1,t-1 + b2 D1,t-2+ The only question that remains is how many lags (q) of D1,t will we need to forecast the series To determine the number of lags we use several tests
Number of Lags for AR(p,q) Model Partial autocorrelation coefficients used to estimate number of lags for Di,t in model. If D1,t is stationary then: Test for one lag use b1from OLS regression model D1,t = a + b1 D1,t-1 Test for two lags use b2from OLS regression model D1,t = a + b1 D1,t-1+ b2 D1,t-2 Test for three lags use b3 from OLS regression model D1,t = a + b1 D1,t-1+ b2 D1,t-2+ b3 D1,t-3 After each regression we only use the beta (bi) for the maximum number of lags, i.e., the bold ones above Use the t stat on the bi to determine contribution of the last lag to explaining D1,t So this calls for running lots of regressions with different numbers of lags, right?
Determining No. of Lags with Simetar Find the optimal number of lags the easy way Use Simetar to build a Sample Autocorrelation Table (SAC) =AUTOCORR(Data Series, No. Lags, No. Diff) Pick best no. of lags based on the last lag with a statistically significant t value
Number of Lags for Time Series Model Bar chart of autocorrelation coefficients in Sample AUTOCORR() Table The explanatory power of the distant lags is not large enough to warrant including in the model, based on their t stats, so do not include them.
Autocorrelation Charts of Sample Autocorrelation Coefficients (SAC) 1 1 Lag k Lag k -1 Dying down in a dampened exponential fashion oscillation A SAC that cuts off -1 1 1 Lag k Dying down quickly Lag k -1 Dying down in a dampened exponential fashion no oscillation -1 1 Lag k Dying down extremely slowly -1
Second Method for Determining the Number of Lags Using Simetar Schwarz Criteria (SIC) tests for the optimal number of lags in a TS model Objective is to find the number of lags which minimizes the SIC In Simetar use the ARLAG() function which returns the optimal number of lags based on SIC test =ARLAG(Data Series, Constant, No. of Differences)
Schwarz Criteria and ARLAG Tables ARLAG indicates no. of lags to minimize SC > 1 lag, given the no. of differences. Pick the no. of lags to Minimize the SC > 1 lag Autocorr finds no. of lags where AC drops > 1 lag
Summarize Stationarity/Lag Determination Make the data series stationary by differencing the data Use the Dickie-Fuller Test (df < -2.90) to find Di series that is stationary Use the =DF() function in Simetar Determine the number of Lags for the Di series that made the data stationary Use the sample autocorrelation coefficients for alternative lag models =AUTOCORR() function in Simetar Minimize the Schwarz Criteria =ARLAG() or =ARSCHWARZ() functions in Simetar
Note: Partial vs. Sample Autocorrelation Partial autocorrelation coefficients (PAC) show the contribution of adding one more lag. It takes into consideration the impacts of lower order lags A beta for the 3rd lag shows the contribution of 3rd lag after having lags 1-2 in place D1,t = a + b1 D1,t-1 + b2 D1,t-2 + b3 D1,t-3 Sample autocorrelation coefficients (SAC) show contribution of adding a particular lag. A SAC for 3 lags shows the contribution of just the 3rd lag. Thus the SAC does not equal the PAC
Number of Lags for Time Series Model Some authors suggest using SAC to determine the number of differences to achieve stationarity If the SAC cuts off or dies down rapidly it is an indicator that the series is stationary If the SAC dies down very slowly, the series is not stationary This is a good check of the DF test, but we will rely on the DF test for stationarity


 Model")