Comprehensive Operational Review
This presentation showcases the comprehensive operational review mid-study report from July 2017, including project progress, organization of the mid-study report, and analysis of trips by region over FY13-FY16. It details key assessments, fleet needs, service management, technology, financial analysis, and more, conducted by NelsonNygaard Consulting Associates, Inc.

Download Presentation

Please find below an Image/Link to download the presentation.
The content on the website is provided AS IS for your information and personal use only. It may not be sold, licensed, or shared on other websites without obtaining consent from the author.If you encounter any issues during the download, it is possible that the publisher has removed the file from their server.
You are allowed to download the files provided on this website for personal or commercial use, subject to the condition that they are used lawfully. All files are the property of their respective owners.
The content on the website is provided AS IS for your information and personal use only. It may not be sold, licensed, or shared on other websites without obtaining consent from the author.
E N D
Presentation Transcript
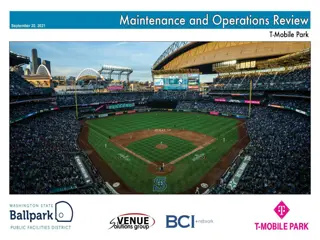
Comprehensive Operational Review Mid-Study Report Presentation July 2017
Meeting Agenda Project Progress Peer Review Review of Key Assessments Fleet Needs and Service Mix Management and Oversight Services Beyond ADA Minimum Requirements Technology Financial Analysis Service Mode/Design Alternatives Nelson\Nygaard Consulting Associates, Inc. 2
Project Progress Jan-Mar 2017 Apr-May 2017 Jun-July 2017 Aug-Oct 2017 Project Kick-Off Data Collection Site Visit Interviews Existing Conditions Peer Review Analyses TPAC/CAC/Board Feedback: Mid-Study Findings Fine-Tuning of Recommendations Final Report Draft Mid-Study Report: - Overview of Access - Policies and procedures - Mgmt and oversight - Service/cost performance - Peer review - Overarching issues - Key assessment areas Final Mid-Study Report - June TPAC/CAC mtgs - Report sent on June 30 - July TPAC/CAC mtgs - Board workshop Draft/Final Report - Recommendations - Implementation plan - Final Presentation Project Kick-Off /Interviews - TPAC/CAC Board mtgs - Technical data gathering - Site visits to providers - Site visit to Access Nelson\Nygaard Consulting Associates, Inc. 3
Mid-Study Report Organization Existing Conditions Review Overview of Access and Access Paratransit Review of Policies, Procedures, and Practices Review of Access Management and Oversight Service and Cost Performance Peer Review Key Assessment Areas Overarching Issues Assessment of Policies, Procedures, and Practices Assessment of Management and Oversight Functions Assessment of Supporting Technology Financial Analysis Assessment of Service Model Structures (Service Designs) Preliminary Recommendations Nelson\Nygaard Consulting Associates, Inc. 4
Trips by Region (FY13-FY16) FY13- FY16 24% 23% 27% 16% 79% -11% 25% 25% Region FY13 FY14 % FY15 % FY16 % 915,681 540,233 1,131,550 668,602 111,253 46,381 4,361 3,418,061 980,084 574,085 1,254,297 716,780 142,261 43,368 11,193 3,722,068 7% 6% 11% 7% 28% -6% 157% 9% 1,042,759 628,605 1,360,595 756,719 168,251 42,489 6,960 4,006,378 6% 9% 8% 6% 18% -2% -38% 8% 1,132,172 663,340 1,437,977 775,998 199,554 41,489 5,440 4,255,970 9% 6% 6% 3% 19% -2% -22% 6% Eastern West Central Southern Northern Antelope Valley Santa Clarita OMC Back Up Access Total 4.2 million trips in FY16 Annual increases: 6% to 9% LA Basin Regions: 94% of total Southern region has the most trips (1.4 million 33% of total) Significant increase in the Antelope Valley: 18% to 28% Decreases in Santa Clarita: -2% to -6% Nelson\Nygaard Consulting Associates, Inc. 5
Unique Elements of Access Service Design Consolidated/Contracted Functions Between Regions SGT/CTI & MV/Global consolidated reservations SGT/CTI trip exchange MV contracts with Global and SGT for some trips Daily reservations extend beyond ADA minimums in most regions Calls to request inter-region rounds trips are transferred Very signification use of taxi subcontractors in LA Basin Nelson\Nygaard Consulting Associates, Inc. 6
Use of Taxi Subcontractors by Region (FY16) Trips served on Dedicated Runs Operated by Other Contractors Trips served on Dedicated Runs Operated by Contractor Employees Trips Served by Taxi Subcontractors Region % % % 356,314 263,195 663,179 535,403 42% 52% 59% 87% 34,530 16,503 0 5,351 4% 3% 0% 1% 448,163 222,701 466,945 73,318 53% 44% 41% 12% Eastern West Central Southern Northern 1,818,091 59% 56,384 2% 1,211,127 39% Access Total 39% of LA Basin trips are served by taxi subcontractors Now approaching 50% due to higher usage in Northern region Using taxi subcontractors reduces costs for Access contractors Translates into reduced costs for Access at procurement times Nelson\Nygaard Consulting Associates, Inc. 7
Cost Performance FY 13 FY14 FY15 FY16 Cost-operations $106,228,138 $111,874,623 $118,179,282 $135,935,408 Annual increase 5% 6% 6% Passengers 3,481,204 3,794,923 4,092,766 4,334,872 Customer trips 3,418,061 3,722,068 4,066,378 4,255,970 Annual increase 9% 8% 6% Cost per passenger $30.51 $29.48 $28.88 $28.98 Cost per trip $31.08 $30.06 $29.06 $31.94 Annual Increase -3% -2% 0.4% Relatively level increases in unit costs despite 5%-6% annual ridership increases Because payment to contractors is based on per trip rates Nelson\Nygaard Consulting Associates, Inc. 8
Peer Service Model Comparison Peer Systems Similarities/Differences Atlanta Agency intakes reservations; other functions outsourced to 1 contractor Boston Decentralized; zones overlap in core area; 3 providers; changing to CC Chicago Decentralized; centralized scheduling by regional CC; 4 providers Dallas One turnkey contractor with taxi subcontractor (70%) Houston Agency call center; 2 unzoned service providers, one with taxis (11%) New Jersey Agency call center; final scheduling and dispatch with 6 zoned providers New York City Call center mgr; agency sched; 13 providers dispatch; 2 NDSP brokers Oakland/East Bay Operational broker; 3 unzoned providers Pittsburgh Decentralized; 6 zoned providers; no taxi subcontractors Portland Call center manager and provider same firm Seattle/King Co Call center manager with 2 service providers; changing to single turnkey Washington, DC Call center manager with 3 service providers; 2 zones; one w/taxis (6%) Nelson\Nygaard Consulting Associates, Inc. 9
Ridership (in millions) Access ridership is the 2nd largest behind only NYC and nearly twice the peer system average 10.0 8.94 9.0 8.0 7.0 Ridership in Millions 6.0 5.0 4.33 4.0 3.10 3.0 Average Ridership 2.30 2.28 2.19 1.90 2.0 1.53 1.55 1.10 0.96 0.82 0.73 1.0 0.52 0.0 Nelson\Nygaard Consulting Associates, Inc. 10
Service Area Population (in millions) Access service area population is the 2nd largest and over twice the peer system average 12.00 10.59 10.00 10.00 8.55 8.00 Population (in Millions) 6.63 6.00 5.00 Average Service Area Population: 4.47 4.02 4.00 2.35 2.35 2.05 2.00 1.70 1.56 2.00 1.30 0.00 Nelson\Nygaard Consulting Associates, Inc. 11
Service Area Size (in square miles) Access ranks 5th in total service are square miles across peers 25.00 21.97 20.00 16.60 Square Miles in Hundreds 15.00 15.00 13.33 13.25 Average Service Area Size: 9.83 10.00 8.23 7.85 7.00 7.00 5.33 5.04 4.00 5.00 3.21 0.00 Nelson\Nygaard Consulting Associates, Inc. 12
Trip Density (trips per square mile) Access ranks 2nd highest in trips per square mile, with nearly twice the peer average (not incl. NYC) 3,500 3,272 New York City: 27,845 (Excluded from Peer Average) 3,125 3,000 2,500 2,328 2,064 1,946 2,000 1,828 Trips per Square Mile Average No. of Trips per Square Mile 1,775 1,520 1,500 1,168 1,166 1,145 1,028 1,000 706 500 0 Nelson\Nygaard Consulting Associates, Inc. 13
Similar and Different Service Models Service Provider Contractors Alternative Service? Location # of Zones NDSP % Reservation Scheduling Dispatch ETA Calls # Ops Dedicated Service Providers 6 6 39% Los Angeles Agency Dedicated Service Provider 1 0 0% Atlanta Dedicated Service Providers 3 3 1% Yes Boston DSPs CCCC DSPs CCCC 4 3 0% Yes Chicago Dedicated Service Providers 1 + Taxi Sub 0 70% Yes Dallas Agency 2 0 11% Yes Houston Agency Agency/DSP DSPs Agency 6 6 0% New Jersey CCCC Agency DSPs CCCC 13 17 30% Yes New York Broker 3 0 0% Yes Oakland Dedicated Service Providers 6 6 0% Pittsburgh Call and Control Center Contractor 1 3 0% Portland (1) Call and Control Center Contractor 2 0 9% Seattle Call and Control Center Contractor 3 2 6% Yes (2) Wash DC (1) Tri-Met s call and control center (CCC) contractor and is the same contractor serving all 3 zones (2) WMATA is planning to implement an alternative service in 2017 Nelson\Nygaard Consulting Associates, Inc. 14
Access vs. Peers: Service Quality KPI Standards Access 0/20 Peers Pick-up Window On-Time Performance 15/15 0/20 20/20 0/30 Denials Missed Trips Excessively Long Trips Telephone Access Complaints/1,000 trips 91% 1% None None < 2:00 < 1:00 to < 3:00 None < 0.75 to < 5.0 90%-92% 94%-95% 92%-98% NR None 0.5% to 1.0% < 2% to < 5% Nelson\Nygaard Consulting Associates, Inc. 15
Access vs. Peers: Service Quality KPIs Access 90.1% - 96.2% (90.8%) 86.0% - 94.5% 0.07% - 0.28% (0.20%) ----- 0.51% - 0.90% (0.74%) 0.1% - 2% 1.43% - 5.95% 0:41 - 1:55 (1:29) 0:49 - 4.82 (3.41) (Avg) Peer Range OTP% Denials% Missed Trip% Long Trips Telephone Access Complaints/1,000 0.16% - 5.4% 0:36 8:05 0.75 5.0 Nelson\Nygaard Consulting Associates, Inc. 16
Access vs. Peers: Operating Cost Per Trip $70 $60.27 $58.14 $57.42 $60 $51.91 $50.00 $46.91 $50 $44.56 Average Operating Cost per Trip $44.50 $42.49 $40 $34.77 $34.05 $30.26 $30 $23.25 $20 $10 $0 Comparatively low unit cost due to: 1: Use of multiple carriers increases competition/more manageable 2: Most trips are served with non-union employees 3: Use of taxi subcontractors Up to 70% of dedicated paratransit cost structure = driver wages and fringe Nelson\Nygaard Consulting Associates, Inc. 17
Access vs. Peers: Technologies Utilized IVR Day-before confirmation IVR Imminent-arrival calls or API Links to Taxi Dispatch Centralized fare account Navigational Assistance IVR Trip cancellations IVR Advance Booking IVR Trip confirmation Customer mobile app Dynamic scheduling Cashless fare card Security Cameras R/S/D Software MDTs/MDCs Agency texts calls AVL Los Angeles Atlanta Boston Chicago Dallas Houston New Jersey New York Oakland/East Bay Pittsburgh Portland Seattle Washington DC Nelson\Nygaard Consulting Associates, Inc. 18
Lessons Learned In large regions, using multiple dedicated service providers is good practice Most peers with multiple service providers use a centralized call and/or control center model Good practice for turn-key model (current Access model) is to request bids with and without call center contract Peers credit centralized model with better customer experience, information, and flexibility Can more easily implement conditional eligibility with centralized model Moving to a centralized model would be a significant change for Access All peers that have service provider contractors with taxi subcontractors use a per-trip rate Nelson\Nygaard Consulting Associates, Inc. 19
Overarching Issues Contractors challenged to fill driver positions Minimum wage increase Service inefficiencies associated with inter-region trips ETA telephone call access and double hold times for some inter-region travelers North County transfers long trips, long delays, labor intensive Limited number of trips Nelson\Nygaard Consulting Associates, Inc. 20
Assessment of Fleet Needs and Service Mix Supply and allocation of Access-owned vehicles: 1 vehicle per 400 monthly trips 910 new vehicles required for 6-year period (FY17 FY22) Capital cost: $50 million Low average vehicle utilization Region DS Trips NDSP Trips DSV Utilization per Day 44% 54% 59% 68% 57% 56% 46% 41% 32% 43% 5.17 VH per day 6.89 VH per day 7.24 VH per day 7.77 VH per day 6.72 VH per day Eastern West Central Southern Northern (April 2017) LA Basin Total Direct correlation with service mix If supply and allocation were based on utilization, Access could reduce replacement needs by 8% ($4 million) Nelson\Nygaard Consulting Associates, Inc. 21
Assessment of Access Management & Oversight Level of management & oversight: excellent Data management & analysis: excellent Financial management: excellent Areas for Improvement Operations: Reduce reservations call monitoring Reformat daily operations report Fleet Design/Maintenance: Expand staff to reduce borrowing Road Safety staff Provide tablets to staff in field Revisit staff wages Nelson\Nygaard Consulting Associates, Inc. 22
Assessment of Reduced Reservations Hours Assessed LA Basin hours: 6am-10pm to 8am-5pm Extended hours provide great convenience for customers Next-day only policy generates evening calls (7pm-10pm) Reducing hours would concentrate calls; create more peaked demand and not significantly reduce staff/cost Recommendation: do not reduce reservation hours Nelson\Nygaard Consulting Associates, Inc. 23
Assessment of Expanded Service Areas Assessment focused on LA Basin (94% of trips) Analyzed additional trips and cost associated with expanded 0.75 mile corridors to 1.5 mile corridors Expansion area is mostly outside Los Angeles County or undeveloped/agricultural land Some ridership increase, but potential for increase in trip lengths to increase trip rates and vehicle replacement rates Trip increase: 3.9% ($5.3 million in FY17 rates) Trip rate increase: 3.5% ($4.3 million in purchased transportation) Total increase: $9.6 million (7% increase from FY17 budget) Nelson\Nygaard Consulting Associates, Inc. 24
Assessment of Same-Day Service Same-day requests are beyond ADA minimum requirements Three options assessed: Option 1: Space Available Basis more appropriate to 100% dedicated systems and filling empty seats Option 2: Alternative Service TNC-subsidy program could potentially reduce overall costs Option 3: Unrestricted Premium Service Induces significant increase in demand (20%-30%) and cost ($27.2-$40.8 million) Recommendation: Option 2 has the greatest potential to offer additional mobility and reduce overall cost Nelson\Nygaard Consulting Associates, Inc. 25
Alternative Service Characteristics Optional service for ambulatory customers and customers using wheelchairs Access customers request on-demand service from TNC via app or concierge phone service Customers pay base fare via any media accepted by TNC (including pre-paid debit cards) Customers pay fare + overage beyond Access subsidy Example $16 trip: $3 fare + $12 subsidy + $1 overage fare Can start with limited pilot (# of customers, service area) Does not fall under ADA paratransit regulations Nelson\Nygaard Consulting Associates, Inc. 26
Example of How Access Would Reduce Costs Access would set base fare and subsidy level unconstrained Example above: Access would save $24 for each diverted trip, but pay out $12 for each new trip The bet: Access will save more from diverted trips than the additional payout in subsidies for newly generated trips Nelson\Nygaard Consulting Associates, Inc. 27
Alternative Service Pilot MBTA (Boston) Pilot: trip caps based on each customer s use of THE RIDE ADA paratransit service Broward County, Las Vegas, and Washington DC implementing similar pilots (w/ caps in Broward County & Las Vegas) All have extensive reporting requirements for TNCs Different solutions for supplying WAV service Recommendation: Develop a pilot design with trip caps Nelson\Nygaard Consulting Associates, Inc. 28
Assessment of Technology Region: Eastern SGT West Central CTI Northern MV Southern Global Santa Clarita City/MV Antelope Valley Keolis Contractor Trapeze** Trapeze ADEPT Reservations TSS/5M* Trapeze Trapeze DDS*** DDS*** Trapeze Trapeze ADEPT ADEPT Scheduling Dispatch TSS/5M TSS/5M TSS/5M* Trapeze DDS*** Trapeze ADEPT ETA Info Yes No No No No IVR Booking IVR Imminent Arrival Calls Yes Yes Yes Yes Yes Available, not being used Available, not being used Available, not being used* Available, not being used** Web Booking Eventually moving to a single-system platform makes sense Competitive procurement recommended Pathway to centralization Good use of IVR; Access also developing Where s My Ride app ATBOS excellent consolidated reporting Excellent use of SmartDrive on-board vehicle monitoring system Nelson\Nygaard Consulting Associates, Inc. 29
Financial Trend Analysis (FY12 FY17) 160,000,000 140,000,000 120,000,000 100,000,000 80,000,000 60,000,000 40,000,000 20,000,000 0 FY 2012 FY 2013 FY 2014 FY 2015 FY 2016 FY 2017 Budget Purchased Transportation Other Direct Expenses Indirect Expenses Annual cost increases from 5.3% to 8.2% Annual trip increases from 5.9% to 9.0% Annual cost per trip increases no more than 1.1%; average -0.7% Nelson\Nygaard Consulting Associates, Inc. 30
Baseline Financial Projections (FY18 FY22) FY 2018 FY 2019 FY 2020 FY 2021 FY 2022 $163,043,181 $177,570,820 $193,724,621 $211,614,808 $231,211,246 Total Cost of Operations 19.9% 8.9% 9.1% 9.2% 9.3% Annual Increase 4,799,000 5,137,000 5,508,000 5,913,000 6,349,000 Passengers (total boardings) 3.5% 7.0% 7.2% 7.4% 7.4% Annual Increase $33.97 $34.57 $35.17 $35.79 $36.42 Cost per Passenger 15.9% 1.7% 1.7% 1.8% 1.8% Annual Increase Total cost of operations: $231 million by FY22 Excludes eligibility, CTSA activities, and general administration Passenger growth based on HDR projections Cost per passenger increases 15.9% in FY18, mostly for driver wage increases After FY18, cost per passenger increases 1.8% per year on average Nelson\Nygaard Consulting Associates, Inc. 31
Service Mode/Design Alternatives What do we want to fix? Inter-region service inefficiencies Deadhead between regions Inter-region call transfers for trip requests (and extra hold times) Nelson\Nygaard Consulting Associates, Inc. 32
Intra- & Inter-Region Weekday Trips (Oct 16) Drop Off Region Trips to Other Regions Percent to Other Regions West Central Antelope Valley Santa Clarita Eastern Southern Northern Pick Up Region 42,147 18,925 Eastern 6,705 7,336 4,884 31% 14,635 21,632 West Central 6,159 11,616 3,855 1 1 60% 58,386 20,502 Southern 6,872 11,773 1,857 26% 35,224 11,861 Northern Antelope Valley Santa Clarita 4,795 4,757 1 2,306 1 2 6 25% 11,033 357 350 205 3% 2,737 205 7% 59,973 37,871 79,644 46,375 11,035 2,746 73,482 Total Trips 31% 31% of weekday trips are between regions 60% of West Central trips go to other regions West Central has fewest trips of LA Basin regions 14% of vehicles hours are due to deadhead between regions Nelson\Nygaard Consulting Associates, Inc. 33
Alternative Service Models Alternative 1: Revised Service Region Boundaries Alternative 2: Revised Number of Regions Alternative 3: Targeted Inter-region Operation Alternative 4: Core Overlap Area Alternative 5: Centralized Call Center Alternative 6: Centralized Call and Control Center Nelson\Nygaard Consulting Associates, Inc. 34
Alternatives 1 and 2 Insignificant Savings Alternative 1: Revision of current LA Basin boundaries Analysis: Insignificant or no savings Moving boundaries would add as many cross-boundary trips as it eliminates Alternative 2: Revised number of LA Basin regions: 3 larger regions or 5 smaller regions Analysis: Insignificant or no savings 3 regions: dividing West Central would add a lot of inter-region trips. Small reduction in admin costs with one less contractor 5 regions: many more inter-region trips. Increase in admin costs due to additional contractor Nelson\Nygaard Consulting Associates, Inc. 35
Alternatives 3 and 4 Merit Further Consideration Alternative 3: Targeted Inter-region Operation Contractors serve return leg of inter-regional trips to high-volume destinations; no call transfer Analysis: Savings to be determined based on destinations Minimal disruption; general method of operating still intact Potential pathway to Alternative 4 Alternative 4: Core Overlap Area No West Central contract. Central area is served by all three contractors serving the other regions. Analysis: Significant savings: $4.4 million (3.9%) Minimal disruption; general method of operating still intact One less contractor; core area customers can use any contractor for trips within the core area West Central contract was just awarded Nelson\Nygaard Consulting Associates, Inc. 36
Alternative 5 Moderate Savings & Disruption Alternative 5: Centralized reservations for all but Santa Clarita Region; could add Santa Clarita later Analysis: Moderate savings: $1.8 million (1.6%) Reservations/ETA calls handled by Call Center Manager Common software platform required; efficiencies gained by considering entire fleet for each trip Neutral call center manager does preliminary scheduling Moderate disruption: final scheduling, dispatching, and use of taxis would be the same as now Merits further consideration Potential pathway to Alternative 6 Nelson\Nygaard Consulting Associates, Inc. 37
Alternative 6 Significant Savings & Disruption Alternative 6: Centralized Call and Control Analysis: Significant savings: $4.3 million (3.8%) Neutral call and control center manager Option A: Central control does reservations, scheduling and dispatch (all functions except service delivery) Option B: Service providers do dispatching, but are dispatchers co- located at call and control center Common software platform required; efficiencies gained by considering entire fleet for each trip Boundaries not needed; bid packages would be used instead; permits mid-contract performance-based adjustments Significant disruption; some options for assignment of trips to taxi subcontractors may not be optimal Not recommended at this time; Alternative 4 offers similar level of savings with far less disruption Nelson\Nygaard Consulting Associates, Inc. 38
Summary of Alternatives Annual Savings Prelim Rec. Alternative Model Disruption Why? Do not pursue 1. Boundary changes Minimal Minimal Not worth it Do not pursue 2. 3 or 5 LA regions Minimal Minimal Not worth it Avoids some call transfers. Improves efficiency 3. Targeted inter-region operation Minimal (TBD) Minimal Consider Significant ($4.4m) No call transfers. Improves efficiency. 4. Core Overlap Area Minimal Consider Moderate ($1.8m) No call transfers. Improves efficiency 5. Central Call Center Moderate Consider Significant ($4.3m) Do not pursue Alternative 4 has same savings, less risk. 6. Central Call & Control Significant Nelson\Nygaard Consulting Associates, Inc. 39


")

")


")
")
")
")


")
")

")