Conducting a Science Experiment Using the Scientific Method
This PowerPoint template guides you through each step of conducting a science experiment using the Scientific Method. From defining your problem or purpose to forming a hypothesis, establishing variables, conducting research, and more, this template helps organize your project effectively.
Download Presentation

Please find below an Image/Link to download the presentation.
The content on the website is provided AS IS for your information and personal use only. It may not be sold, licensed, or shared on other websites without obtaining consent from the author. If you encounter any issues during the download, it is possible that the publisher has removed the file from their server.
You are allowed to download the files provided on this website for personal or commercial use, subject to the condition that they are used lawfully. All files are the property of their respective owners.
The content on the website is provided AS IS for your information and personal use only. It may not be sold, licensed, or shared on other websites without obtaining consent from the author.
E N D
Presentation Transcript
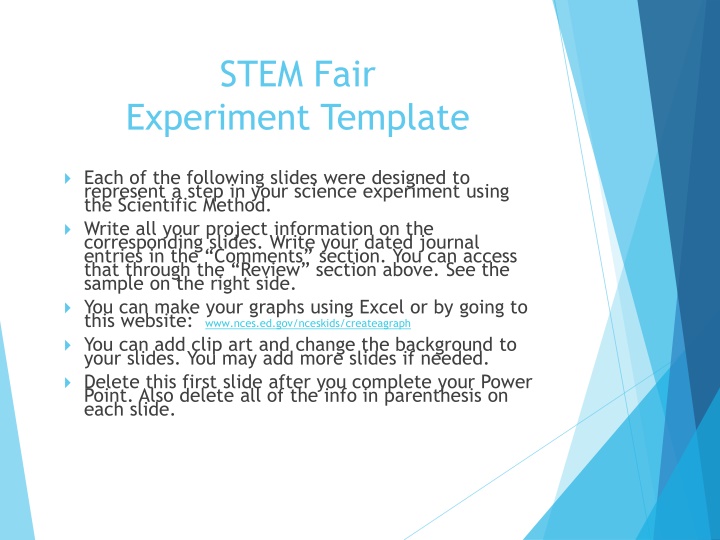
STEM Fair Experiment Template Each of the following slides were designed to represent a step in your science experiment using the Scientific Method. Write all your project information on the corresponding slides. Write your dated journal entries in the Comments section. You can access that through the Review section above. See the sample on the right side. You can make your graphs using Excel or by going to this website: www.nces.ed.gov/nceskids/createagraph You can add clip art and change the background to your slides. You may add more slides if needed. Delete this first slide after you complete your Power Point. Also delete all of the info in parenthesis on each slide.
Problem or Purpose (What are you trying to find out? State this in question form. Make sure that this is a testable question. This means that you must be able to measure the change that occurs.)
Research (You must have info from three sources. You need to write a paragraph stating what you learned from your research and how it relates to your testable question. Be sure to state your source. These examples may help you.) (Source stating examples) (For a book Sciencesaurus : a Student Handbook, Wilmington, MA :Great Source Education Group, 2002.) (For a website - https://www.thoughtco.com/who-invented-the-umbrella-1992592 ) Source #1
Research (This is your second source. You need to write a paragraph stating what you learned from this source and how it relates to your testable question. Be sure to state your source.) Source #2
Research (This is your third source. You need to write a paragraph stating what you learned from this source and how it relates to your testable question. Be sure to state your source.) Source #3
Hypothesis (Make your testable question into an If ..then .. statement.)
Variables Independent Variable: (What will you change?) Constant Variables: (What things will stay the same?) Dependent Variable: (What will you measure?) Control: (Are you testing a change against an already known result? State Yes or No and explain how you know that.)
Materials (List your materials here in bullet form. Be specific. Include your metric measurement tools.)
Procedure (Numbered, step-by-step directions - Be sure to use metric measurements!)
Data (What did you measure? Make sure this is in metric units.) Number of ________ Trial 1 Trial 2Trial 3 Average SAMPLE
Graph Trial #1 (You will make one graph for each trial as well as an overall graph.) (You can make your graphs at this website: www.nces.ed.gov/nceskids/createagraph
Graph Trial # 2 (You will make one graph for each trial as well as an overall graph.) (You can make your graphs at this website: www.nces.ed.gov/nceskids/createagraph
Graph Trial # 3 (You will make one graph for each trial as well as an overall graph.) (You can make your graphs at this website: www.nces.ed.gov/nceskids/createagraph
Graph Overall Results (You will make one graph for each trial as well as an overall graph.) (You can make your graphs at this website: www.nces.ed.gov/nceskids/createagraph
Results (Write the data from the table in paragraph form. See the sample projects for examples.)
Conclusion (Write a summary of your experiment. This should be in paragraph form. State if your hypothesis was correct or incorrect and explain why. Tell about the strengths and weaknesses of your experimental design.)
Applications (How can your findings from your experiment be used or helpful in the real world?)
Pictures (Add pictures here of your experiment.)

