Conducting Impact Evaluation in Difficult Contexts: Lessons from Georgia
Challenges and solutions in conducting impact evaluation in conflict-affected Georgia, focusing on the use of geospatial data for sampling and measuring economic changes in project beneficiaries. Key insights and future implications discussed.

Download Presentation

Please find below an Image/Link to download the presentation.
The content on the website is provided AS IS for your information and personal use only. It may not be sold, licensed, or shared on other websites without obtaining consent from the author. If you encounter any issues during the download, it is possible that the publisher has removed the file from their server.
You are allowed to download the files provided on this website for personal or commercial use, subject to the condition that they are used lawfully. All files are the property of their respective owners.
The content on the website is provided AS IS for your information and personal use only. It may not be sold, licensed, or shared on other websites without obtaining consent from the author.
E N D
Presentation Transcript
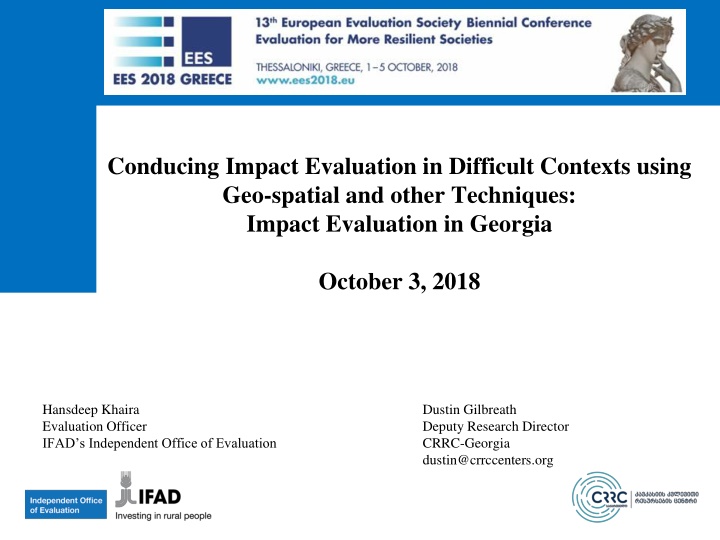
Conducing Impact Evaluation in Difficult Contexts using Geo-spatial and other Techniques: Impact Evaluation in Georgia October 3, 2018 Hansdeep Khaira Evaluation Officer IFAD s Independent Office of Evaluation Dustin Gilbreath Deputy Research Director CRRC-Georgia dustin@crrccenters.org
Organization of the talk Country context The Agricultural Support Project Uses of Geo-spatial data within the evaluation Lessons learned, potential extensions, and future work
Georgia: Country context 2 wars of secession in 1990-1991 Civil war in 1990-1991 August 2008 war (breaks out in South Ossetia, extends to Abkhazia) ~250,000 internally displaced people (~7% of population) Right of return not happening, and slow moving ethnic cleansing particularly in Abkhazia. Quasi-frozen conflict, however people on the administrative boundary line face regular issues (e.g. abductions, cattle theft, and a moving boundary line).
Agricultural Support Project Challenges of undertaking evaluation in the country context - Restricted mobility in some areas of the country (occupied areas) - Data limitations Solution Geospatial analysis - Sampling - Analysis
Agricultural Support Project Developmental objectives Increase assets & incomes among rural poor. Remove infrastructural bottlenecks. Project interventions Rehabilitation of irrigation canals Bridges for livestock movement Drinking water infrastructure Leasing products for agricultural businesses
Objective and approach of evaluation Objective of impact evaluation Measure the economic changes in the lives of project beneficiaries using inter alia income and changes in agricultural production as indicators Approach Ex-post quasi-experimental method
Use of geospatial data for sampling Challenge Solution: Match on cluster level demographic and geo-spatial characteristics for the infrastructure component, prior to intervention: NDVI Gender balance of adults in communities Ethnic minority community Adult population size Average elevation Distance to a primary road Distance to a secondary road Distance to a tertiary road Distance from a regional center Area of the district Koppen climate classification Population density Propensity scores No random assignment of treatments at the individual or cluster level; Lack of adequate baseline data.
Use of geospatial data for sampling Comparison of cluster level balance with matched versus random selection of control clusters: - Minimum p-value: Random sample: p= 0.004107** Matched sample: p=0.14894 - Number of significant differences at cluster (community) level: Random sample: 3 variables (6 tests) Matched sample: 0
Topline survey results Irrigation communities increase in agricultural incomes. Bridge communities Drinking water communities drinking water, but other wise null results. Leasing indirect beneficiaries increases in agricultural incomes. Increased amount of irrigated land, but no Null results all around. Slight decrease in amount of time getting Statistically and substantively significant
Use of geospatial data for analysis NDVI To estimate magnitude & significance of difference in vegetation development (NDVI) based on temporal variations (project baseline 2013 and endline 2016) The rationale is that project interventions will cause a different pattern of change from before to after the treatment compared with similar areas not treated by the project.
Use of geospatial analysis The methodology applied is derived from the Before/After Control/Impact BACI contrast presented in a recent research paper. Data: Analysis performed using 250-m NASA MODIS NDVI product (8 days) from 2004 to 2016 (Landsat on going) Project Area: Five irrigation schemes that were rehabilitated as part of project intervention. Farm plots split into three sizes: small (< 2ha), medium (2-10ha) large (> 10ha) - to understand better the effect on different types of farmers. Selection of non-treated sites based on: similar land cover geographic proximity not subjected to intervention randomly selected
Use of geospatial analysis - The impact of the intervention is evaluated by the change between T and NT before and after the intervention. BACI contrast = ( NTa NTb) ( Ta Tb ) where is the site-specific spatial NDVI mean; NTa, Ta stand respectively for non- treated area and treated area at endline (after); NTb and Tb stand respectively for non-treated area and treated area at baseline (before). - By convention, a negative BACI contrast indicates that the variable has increased more in the intervention site with respect to controls in the time period before and after intervention. - The BACI analysis provides two important statistics: the significance level (P-value) of the BACI effect test and the BACI contrast*. - *The (null) hypothesis of no change was rejected at the conventional 5% significance level.
Use of geospatial analysis BACI index (contrast) Relative contrast % Before and After Time-frame Perimeter name Zone P-value 0.0080061 Does-Grakali full area -0.0052 -0.73 2011-13vs2014-16 0.0002820 Does-Grakali medium fields -0.0155 -2.16 2011-13vs2014-16 0.2066130 Does-Grakali small fields -0.0067 -0.89 2011-13vs2014-16 0.0000150 Lami-Misaktsieli full area 0.0024 0.34 2011-13vs2014-16 0.0892510 Lami-Misaktsieli large fields -0.035 -4.9 2011-13vs2014-16 0.0000470 Lami-Misaktsieli medium fields 0.0203 2.89 2011-13vs2014-16 0.0004710 Lami-Misaktsieli small fields 0.0036 0.48 2011-13vs2014-16 0.0001090 Karagaji full area 0.0216 2.98 2012-14vs2015-16 0.0058530 Karagaji small fields -0.0031 -0.41 2012-14vs2015-16 0.2082250 Metehki full area 0.0065 0.85 2012-14vs2015-16 0.0001110 Metehki small fields -0.0113 -1.45 2012-14vs2015-16 0.0145280 Dzevera-Shertuli full area 0.0043 0.61 2013-15vs2016 0.3925540 Dzevera-Shertuli medium fields 0.0595 9.24 2013-15vs2016 0.0140050 Dzevera-Shertuli small fields -0.0044 -0.63 2013-15vs2016 Negative BACI contrasts (in bold) Green background is used to highlight negative BACI contrasts that are significant at the 0.05 P-value Light green background is used to highlight negative BACI contrasts that are very close to significant 0.05 P-value Grey background indicates a non-significant/no BACI effect.
Results Field mission Results of ground-truthing carried out though a field mission confirmed the low uptake of irrigation in intervention areas. Some of the increase in vegetation was due to more grass being grown (livestock fodder). Impact Evaluation Results of HH survey also showed statistically significant increase in land area available for irrigation but insignificant increase in area irrigated after intervention.
Uses of geo-spatial the project inspired for us, but we didn t use Multi-level models incorporating cluster level data - More stable estimates, better controlled models Synthetic controls applications of geo-spatial data
Some notes on synthetic controls using geo-spatial What is a synthetic controls model and what do you need? (Abadie, Diamond, and Hainmueller, 2015)
Some notes on synthetic controls using geo-spatial How could this model be used with geo-spatial data? - Outcome variables a good geographer can get from a satellite or other geo-spatial means: Night lights (a reasonable proxy for income, though problems exist at the unit level) NDVI Many more that I m not aware of, because I m not a geographer - Covariates that a good geographer can get from a satellite or other geo- spatial means: Distance from a primary, secondary, or tertiary road (access to markets); Altitude Climate classification Distance from a conflict line Distance from an international border
Some notes on synthetic controls using geo- spatial - Other variables that you can often get in time series, but are not necessarily geo-spatial: Population (from a countries list of electoral precincts) Gender balance (if the country s voter list is public) Education level (if the census is available at the cluster level) Ethnicity/language spoken (if the census is available at the cluster level)
Some notes on synthetic controls using geo- spatial What are the implications: Survey-less evaluation 1.You can get a reasonable estimate of economic impact without doing a survey 2.You can get a reasonable estimate of whether something happened or not without doing a survey 3.You don t necessarily have to be on the ground, potentially leading to quick, good enough impact evaluation; 4.You can get access to hard to access places including conflict affected areas. Improvement on existing geo-spatial methods
Lessons learned, applications, and things we thought of afterwards that might be valuable for others Improved control group selection through matched sampling using geo- spatial data rather than sampling a random control group in post-hoc, quasi- experimental settings Multi-level modeling to control for environmental factors makes sense (more stable estimates, in an environment where estimation is difficult) Synthetic controls modeling would be a step up over the hand selection of control groups in the BACI Synthetic controls modeling generally deserves a great deal of additional attention with geo-spatial data, because it has the potential to remove the need to do on the ground surveys;