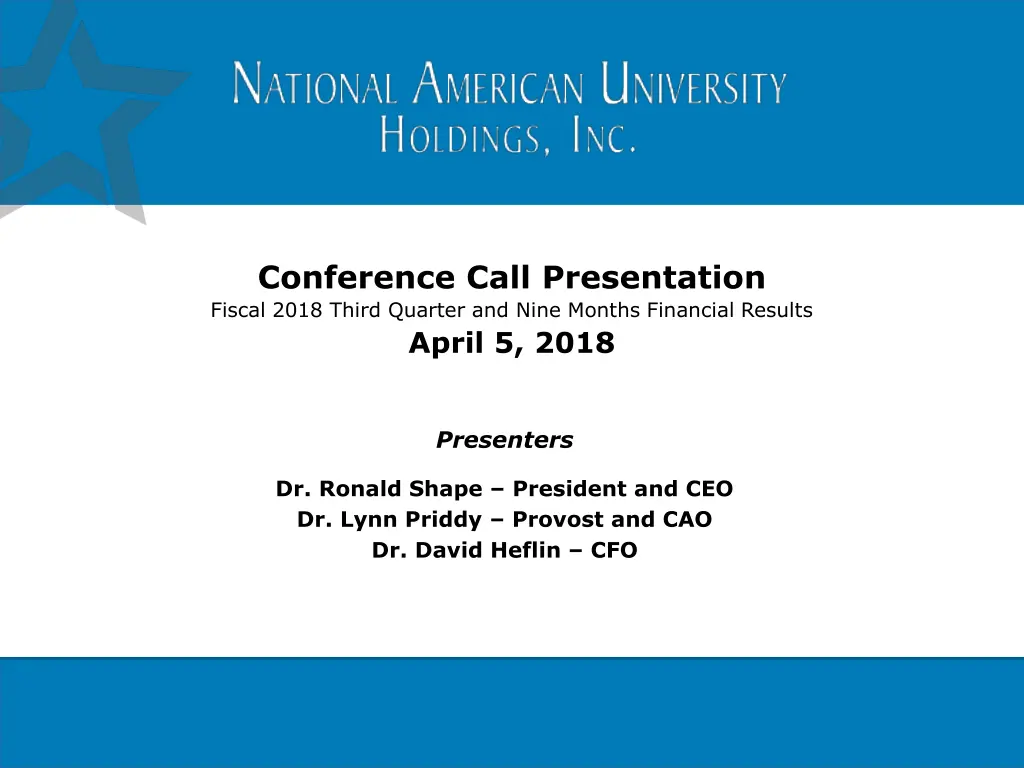
Conference Call Presentation Fiscal 2018 Third Quarter and Nine Months Financial Results
Explore the fiscal 2018 third quarter and nine months financial results of National American University Holdings, Inc. with insights on operational drivers, enrollment trends, and strategic focus. Learn about the company's online and ground operations, enrollment growth, and key initiatives for future success. Stay informed about the challenges and opportunities facing the education industry as discussed by the presenters.

Download Presentation

Please find below an Image/Link to download the presentation.
The content on the website is provided AS IS for your information and personal use only. It may not be sold, licensed, or shared on other websites without obtaining consent from the author. If you encounter any issues during the download, it is possible that the publisher has removed the file from their server.
You are allowed to download the files provided on this website for personal or commercial use, subject to the condition that they are used lawfully. All files are the property of their respective owners.
The content on the website is provided AS IS for your information and personal use only. It may not be sold, licensed, or shared on other websites without obtaining consent from the author.
E N D
Presentation Transcript
Conference Call Presentation Fiscal 2018 Third Quarter and Nine Months Financial Results April 5, 2018 Presenters Dr. Ronald Shape President and CEO Dr. Lynn Priddy Provost and CAO Dr. David Heflin CFO
Safe Harbor This presentation may contain forward-looking statements within the meaning of the Private Securities Litigation Reform Act of 1995, about National American University Holdings, Inc. and its affiliated entities (the Company ). Forward-looking statements are statements that are not historical facts. Such forward-looking statements, based upon the current beliefs and expectations of the Company s management, are subject to risks and uncertainties, which could cause actual results of the Company to differ from any future results expressed or implied by such forward-looking statements. The following factors, among others, could cause actual results to differ from those set forth in the forward-looking statements: future operating or financial results; uncertainties regarding the strength of the future growth of the education industry; uncertainties regarding the availability of student loans and other financing sources primarily used for tuition; continued compliance with government regulations; changing legislative or regulatory environments; management of growth; intensity of competition; the availability of cash to pay dividends; the ability to meet debt obligations or obtain additional financing to fund operations and/or acquisitions; changing interpretations of generally accepted accounting principles; and general market and economic conditions, as well as other relevant risks detailed in the Company s filings with the Securities and Exchange Commission, including its annual report on Form 10-K, which the Company filed on August 4, 2017. The information set forth herein should be read in light of such risks. The Company does not undertake any obligation to update anyone with regard to the forward-looking statements. 2
Strategic Focus Operational Drivers Online Enrollmentgrowth Fully developed KC Online operation On-ground Enrollment decline Consolidating ground operations (10 campuses in Q3) Military Enrollment growth Closed HPU asset purchase transaction on March 21st Canada Enrollment growth Developing new relationships with private institutions Graduate Enrollment growth 3
Winter 2017/18 Enrollment by Credit Hour 70000 66287 62607 60000 57434 53622 50000 Division FY 2016 Surplus % Surplus $ DL 42.28% $ 3,963,440 Ground 2.47% $ 1,908,478 (429,966) Grad -12.95% 137,827 9345 8215 10000 FY 2017 Surplus % 45.61% $ 4,496,760 40.02% $ 939,029 0.96% $ 644,462 -2.95% $ Q1 FY2018 (8/31/17) Surplus $ Surplus % 42262 Surplus $ 40000 33243 30000 $ (497,694) 6.63% $ 327,841 10.42% $ 20000 12629 7849 4345 3252 3196 2372 1665 1629 1616 770 295 27 0 0 Online On Ground CMS (Military) Canada Online Graduate Teach Out Total Winter 15-16 Actual Winter 16-17 Actual Winter 17-18 Actual 4
Operational Driver: Online Drive consistency of service and support to online students by consolidating all online divisions under one operational leadership Utilize the KC Online operation with the ability to scale online student enrollment growth goals for the University Division FY 2016 Surplus % Surplus $ DL 42.28% $ 3,963,440 Ground 2.47% $ 1,908,478 (429,966) Grad -12.95% 137,827 online students FY 2017 Surplus % 45.61% $ 4,496,760 40.02% $ 939,029 0.96% $ 644,462 -2.95% $ Sustain growth expectations through strong enrollment management processes and student support systems focused on Q1 FY2018 (8/31/17) Surplus $ Surplus % Surplus $ Drive innovation in all processes to ensure quality, compliance, growth, and sustainability $ (497,694) 6.63% $ 327,841 10.42% $ Operate Online as a distinct division, separate and apart from campus-based, Military, Graduate, and Canada operations 5
Online Credit Hours 16000 14000 12000 10000 8000 13400 12629 6000 4000 7559 7485 2000 0 Summer 17 actual Fall 17 actual Winter 17-18 actual Spring 18 proj.
Operational Driver: On-ground Drive consistency of service and support to on-ground students by consolidating operations and creating leadership oversight Utilize the consolidations to provide stability and a foundation to meet enrollment growth goals for the University Division FY 2016 Surplus % Surplus $ DL 42.28% $ 3,963,440 Ground 2.47% $ 1,908,478 (429,966) Grad -12.95% 137,827 on-ground students FY 2017 Surplus % 45.61% $ 4,496,760 40.02% $ 939,029 0.96% $ 644,462 -2.95% $ Q1 FY2018 (8/31/17) Surplus $ Surplus % Surplus $ Drive innovation in all processes to ensure quality, compliance, growth, and sustainability Sustain growth expectations through strong enrollment management processes and student support systems focused on $ (497,694) 6.63% $ 327,841 10.42% $ Operate On-ground as a distinct division, separate and apart from online, Military, Graduate, and Canada operations 7
On-Ground Credit Hours 45000 40000 35000 38817 33242.5 30000 35059.5 30750 25000 20000 15000 10000 5000 0 Summer 17 Fall 17 Winter 17-18 Spring 17 (proj.)
On-ground: Consolidation Plan Roseville, MN: o Bloomington, Brooklyn Center, and Burnsville Mesquite, TX: o Lewisville and Richardson Sioux Falls, SD: o Watertown Albuquerque, NM: Division FY 2016 Surplus % Surplus $ DL 42.28% $ 3,963,440 Ground 2.47% $ 1,908,478 (429,966) Grad -12.95% 137,827 o Wichita West Online Operations: o Houston Colorado Springs, CO: o Colorado Springs South FY 2017 Surplus % 45.61% $ 4,496,760 40.02% $ 939,029 0.96% $ 644,462 -2.95% $ o Albuquerque West Wichita, KS: Q1 FY2018 (8/31/17) Surplus $ Surplus % Surplus $ $ (497,694) 6.63% $ 327,841 10.42% $ 9
Operational Driver: Military Drive consistency of service and support to military students by consolidating military students into one division Create the College of Military Studies and integrate programs from H- PU to provide stability and a foundation to meet enrollment growth goals for the University through consistent service and innovative new programs Drive innovation in all processes to ensure quality, compliance, growth, and sustainability Sustain growth expectations through strong enrollment management processes and student support systems focused on military students Operate the College of Military Studies as a distinct division, separate and apart from online, on-ground, Canada, and Graduate operations 10
Military Credit Hours (College of Military Studies) 5000.0 4500.0 4000.0 3500.0 3000.0 2500.0 4300 2000.0 3251.5 1500.0 2845.5 1000.0 1844.5 500.0 0.0 Summer 17 Fall 17 Winter 17-18 Spring 18 (proj.)
Henley-Putnam Asset Acquisition Purchase price $1.6 million High demand areas, such as, security, protection, intelligence, counterterrorism, cyber security, strategic languages, and nuclear Degrees Acquired: Doctoral Masters Bachelors Certificates Certificates in Development = 14 = 1 = 3 = 3 = 32 Student population: Active (as of March 1) Inactive (approximately) = 241 = 294 Name: Henley-Putnam School of Strategic Security 12
Operational Driver: Canada Drive consistency of service and support to Canadian students by creating a designated Canada division with specific leadership oversight Utilize existing and new relationships as the foundation to build enrollment growth for the University Drive innovation in all processes to ensure quality, compliance, growth, and sustainability Sustain growth expectations through strong enrollment management processes and student support systems focused on Canadian students Operate Canada as a distinct division, separate and apart from online, on- ground, Graduate, and Military operations 13
Canada Credit Hours 1000 900 800 700 875 600 770 718 500 400 417 300 200 100 0 Summer 17 Fall 17 Winter 17-18 Spring 18 (proj.)
Operational Driver: Graduate Drive consistency of service and support to Graduate students by creating a designated Graduate division with specific leadership oversight Utilize existing and new relationships as the foundation to build enrollment growth for the University Drive innovation in all processes to ensure quality, compliance, growth, and sustainability Sustain growth expectations through strong enrollment management processes and student support systems focused on Graduate students Operate Graduate as a distinct division, separate and apart from online, Canada, on-ground, and Military operations 15
Graduate Credit Hours 3400 3357 3300 3316 3200 3196 3100 3000 2984 2900 2800 2700 Summer 17 Fall 17 Winter 17-18 Spring 18 (proj.)
Teach Outs and Transfer Agreements Westwood College Teach Out: Nearing completion (May 2018) Fewer than 40 students remaining Career Point College Teach Out: Nearing completion (February 2019) Fewer than 225 students remaining Colorado Heights University Transfer Agreement: Students fully transferred Approximately 50 students enrolled Zenith Education Group Transfer Agreement: Just beginning (in its second term) Approximately 450 students enrolled 17
Teach-out Credit Hours 8000 7000 7161 6000 5825.5 5000 4000 4345 3000 3100 2000 1000 0 Summer 17 Fall 17 Winter 17-18 Spring 18 (proj.)
Q3 Financial Performance Consolidated 10 locations with an annual expense of $11.6 million (based on January 2018 run rate) Reduction in force of approximately $4 million annually (some of which is included in the $11.6 million of consolidations) Recorded non-cash impairment charges of $1.1 million as a result of the consolidations and asset impairment Net cash flows used in operating activities in FY 2018 third quarter was $(2.6) million. As of February 28, 2018, the cash balance was $4.6 million. The primary uses of cash for the first nine months of FY 2018 were Cash Used in Operations of $6.3 million. 19
Enrollment Breakout Winter 17-18 credit hour enrollment decreased 8.3% YoY to 57,434 credit hours February 28, 2018 (Winter 2017-18 Qtr) February 28, 2017 (Winter 2016-17 Qtr)* Number of Students Number of Students YOY Percent Change % of Total % of Total Continuing Ed Doctoral Graduate Undergraduate & Diploma Total - 0.0% 1.9% 6.6% 91.6% 100.0% 202 98 386 6,628 7,314 2.8% 1.3% 5.3% 90.6% 100.0% -100.0% 13.3% 1.8% -17.4% -18.2% 111 393 5,477 5,981 Number of Credits 46,229 57,434 Number of Credits 11,642 46,491 62,607 YOY Percent Change -49.2% % of Total % of Total On-Campus Online Blended Total 5,910 10.3% 80.5% 9.2% 100.0% 18.6% 74.3% 7.1% 100.0% -0.6% 18.4% -8.3% 5,295 4,474 * Non-degree seeking students were classified as Continuing Ed Students in 2016. 20
Operational Drivers Spring 2018 Credit Hours (Projected) 70000 66062 61772 60000 55782 48496 50000 Division FY 2016 Surplus % Surplus $ DL 42.28% $ 3,963,440 Ground 2.47% $ 1,908,478 (429,966) Grad -12.95% 137,827 9028 8189 10000 FY 2017 Surplus % 45.61% $ 4,496,760 40.02% $ 939,029 0.96% $ 644,462 -2.95% $ Q1 FY2018 (8/31/17) Surplus $ Surplus % 39990 Surplus $ 40000 30750 30000 $ (497,694) 6.63% $ 327,841 10.42% $ 20000 13400 8726 4300 4255 3357 3100 2838 2627 1651 1593 875 379 64 0 Online On Ground CMS (Military)Canada Online Graduate Teach Out Total Spring 16 Actual Spring 17 Actual Spring 18 Projected 22
Academic Initiatives FY 2018-19 Initiatives Implementation of new technologies in online learning that allow for intrusive advising and real-time data to ensure substantive and iterative engagement in online courses by faculty, students, and advisors. All programs and courses will have implemented the new technologies through D2L BrightSpace, which infuses the curricula with learning and engagement technologies, simulations, mobile-first technology, and authentic assessment. Revisions ensure relevant, current competencies, expanded laddered credentials, and embedded certifications designed for NAU s distinctive working adult student. Expand synchronous learning opportunities across the system to serve international and military students needing additional ground courses Maximize growth in graduate programs and baccalaureate degree completion programs. 24
Academic Initiatives FY 2018-19 Initiatives Expand transfer and prior learning assessment options for all students, offering the maximum acceptance of transfer credit, ACE-transcripted credit, and other credit for prior learning. Expand education opportunities uniquely designed to meet the needs of active military, veterans, and their dependents. The expansion of military offerings is anticipated to increase to three master s programs, one doctoral program, and 31 certificates through the consolidation of Henley-Putnam University into NAU. Consolidate ground-based campus health programs for optimum costs; expand online health management and IT programs. Increase the professional development and research and scholarship of graduate faculty and students, as well as undergraduate faculty. Expand graduate programs in human resources, global supply chain management, education, cybersecurity, intelligence management, strategic security, and executive management. 25
Academic Breakdown for Winter 2017/18 Term Academic Area Degree Offering *Non-degree seeking 26
Course Completion 96% 95% 94% 94% 92% 91% 90% 88% 88% 86% 84% Undergraduate Graduate** Q3 FY 2017 Q3 FY 2018 Represents students who received a grade in the course. ** Preliminary for quarter. *Represents students who received a grade in the course. 27
Financials 28
FY 2018 Q3 Revenue and Cost of Educational Services FY 2018 Q3 Results FY 2018 Q3 Revenue Q3 2018 (unaudited) Q3 2017 (unaudited) (in USD thousands) Revenue $18,227 $21,331 Cost of educational services $6,234 $7,629 SG&A $13,817 $15,321 29
FY 2018 Q3 Net Income and EBITDA FY 2018 Q3 Results FY 2018 Q3 EBITDA (LBITDA) Q3 2018 (unaudited) Q3 2017 (unaudited) (in USD thousands) Loss before non- controlling interest and taxes ($3,775) ($2,381) Net loss attributable to NAUH ($3,707) ($2,536) LBITDA* ($2,441) ($938) *Includes $1.1 million in noncash loss on asset impairment in Q3 2018. Please see reconciliation of EBITDA (LBITDA) to net income attributable to the Company in the press release dated April 4, 2018, available at http://www.national.edu/about- nau/investor-relations/. . 30
FY 2018 YTD Revenues and Cost of Educational Services FY Nine Months Results Revenue for FY Nine Months YTD 2017 (unaudited) YTD 2018 (unaudited) (in USD thousands) Revenue $58,041 $64,444 Cost of Educational Services $19,545 $20,594 SG&A $44,633 $47,228 31
FY 2018 YTD Net Income and EBITDA EBITDA (LBITDA) for FY Nine Months FY Nine Months Results YTD 2017 (unaudited) YTD 2018 (unaudited) (in USD thousands) Loss before non- controlling interest and taxes $(11,546) $(6,559) Noncash ass Net loss attributable to NAUH $(11,312) $(5,344) (LBITDA)* $(7,404) $(2,140) *YTD 2018 includes $2.1 million in noncash asset impairments. Please see reconciliation of EBITDA (LBITDA) to net income attributable to the Company in the press release dated April 4, 2018, available at http://www.national.edu/about-nau/investor- relations/. . 32
Balance Sheet February 28, 2018 May 31, 2017 (in USD thousands) Cash and cash equivalents/available for sale investments $4,638 $16,157 Working capital $1,316 $11,249 Long-term debt 0 0 Stockholders equity $17,761 $29,940 33
Thank You Contact Information: National American University Holdings, Inc. Dr. Ronald Shape 605-721-5220 rshape@national.edu Investor Relations Counsel The Equity Group Inc. Carolyne Y. Sohn 415-568-2255 csohn@equityny.com Adam Prior 212-836-9606 aprior@equityny.com 34


")