Confidence Intervals Proportions: Understanding Sampling Distributions and Predictions
Explore the concept of confidence intervals for proportions, the Central Limit Theorem's impact on sampling distributions, and how to predict population proportions. Learn how to calculate confidence intervals, interpret results, and make informed predictions based on statistical analysis.

Download Presentation

Please find below an Image/Link to download the presentation.
The content on the website is provided AS IS for your information and personal use only. It may not be sold, licensed, or shared on other websites without obtaining consent from the author. If you encounter any issues during the download, it is possible that the publisher has removed the file from their server.
You are allowed to download the files provided on this website for personal or commercial use, subject to the condition that they are used lawfully. All files are the property of their respective owners.
The content on the website is provided AS IS for your information and personal use only. It may not be sold, licensed, or shared on other websites without obtaining consent from the author.
E N D
Presentation Transcript
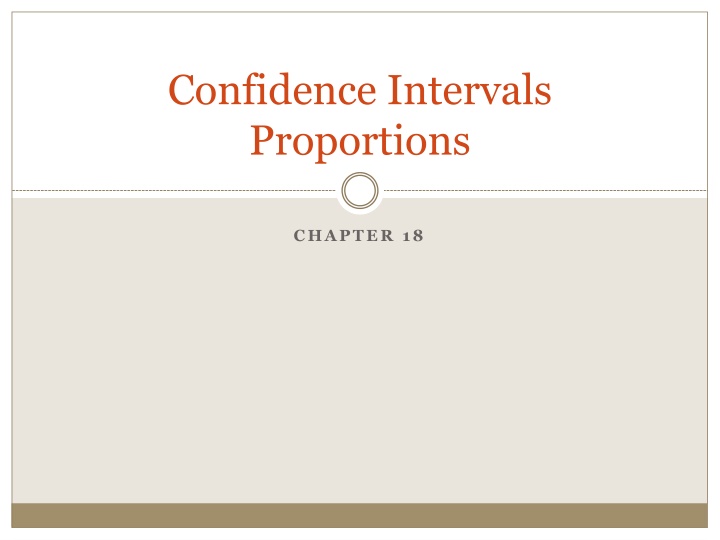
Confidence Intervals Proportions CHAPTER 18
Central Limit Theorem For larger and larger sample size n, we expect the Sampling Distribution s shape to become more Normal (unimodal and symmetric) center to stay the same spread to become smaller For Quantitative Data: SD = ? For Categorical Data: ? where ? = standard deviation of the population ?(1 ?) ? SD = where p = proportion in the population
What if p is unknown? p = Population Proportion (parameter) ? = Sample Proportion (statistic) We can use ?to calculate a confidence interval to predict p!
Predict the proportion of p= BLUE MMs that the Mars Co uses to fill each bag Example: Draw Normal Curve: Calculate ? = ? # sample of blue MM s total sample size ? = ? 0.2352941176 ?=12 ?= 51= STO A ?(1 ?) 51 SD = = STO B ?(1 ?) ? Calculate SD = 0.0593974311 Here the SD is called a standard error = SE Blue MM s n=51 0.24 0.06 0.30 0.36 0.12 0.18 0.42
Example continued Calculate 90% Confidence Interval: Example: Recall 90% center area means 5% left area Pic here Find z = invnorm(0.05) = -1.644853626 Find data = CI = z*SD+center z = invnorm(0.05) = -1.644853626 CI = C*B+A = (0.1375940377, 0.3329941976) STO C
Example continued Example: Check: Use STAT TESTS #A (1-Prop Z Int) x = # sample of blue MM s n = total sample size CI-level = specified Calculate Use STAT TESTS #A (1-Prop Z Int) x = 12 n = 51 CI-level = 0.90 (0.13759, 0.33299) Use this only to check. You will be asked to do full calculation on exam!
Conclusions We don t say We say We are __% confident that the true proportion of __ is between __ and __. We expect __% of all possible confidence intervals calculated with sample size n to contain the true proportion of the population. There is a __% chance of a particular value in the interval. There is a __% chance the proportion of the population is in the interval.
How was our prediction? Mars Co claims that it fills each bag with 24% blue MM s. Raise your hand if 24% is in your interval. We would expect about 90% of the class to have a hand raised!
Predict proportion of brown eyes using class as sample using 95% confidence ?=# sample of brown eyes total class size Calculate ? = ? ?(1 ?) ? Calculate SD = SE = Sketch normal curve Find z = invnorm(0.025) Find data = CI = z*SD+center Check using STAT TESTS #A Make conclusion