Connection Between Individual Characteristics and Colorectal Cancer Screening Rates
Colorectal cancer screening plays a crucial role in early detection and prevention. This study explores the relationship between individual characteristics and rates of colorectal cancer screening in different regions of Louisiana. It highlights disparities in screening rates across urban and rural areas, emphasizing the impact of primary care providers on screening behaviors.
Download Presentation

Please find below an Image/Link to download the presentation.
The content on the website is provided AS IS for your information and personal use only. It may not be sold, licensed, or shared on other websites without obtaining consent from the author.If you encounter any issues during the download, it is possible that the publisher has removed the file from their server.
You are allowed to download the files provided on this website for personal or commercial use, subject to the condition that they are used lawfully. All files are the property of their respective owners.
The content on the website is provided AS IS for your information and personal use only. It may not be sold, licensed, or shared on other websites without obtaining consent from the author.
E N D
Presentation Transcript
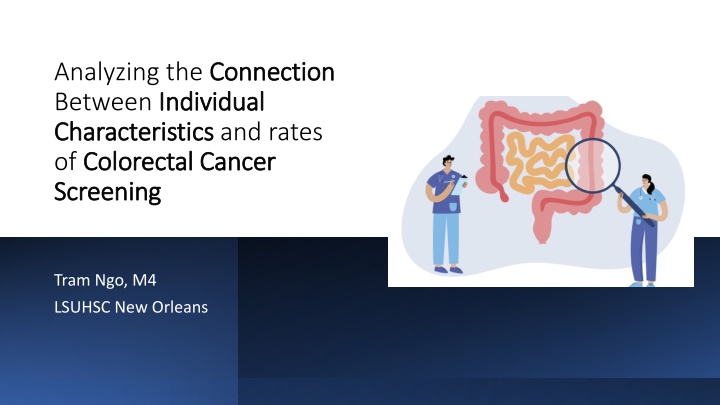
Analyzing the Connection Between Individual Individual Characteristics Characteristics and rates of Colorectal Cancer Colorectal Cancer Screening Screening Connection Tram Ngo, M4 LSUHSC New Orleans
Summary (from previous project) Colorectal cancer screening (CCS) rates in urban vs rural Louisiana in 2023 were the same (44%) CCS rates across different regions in Louisiana varied Highest: region 1 and 3 Lowest: region 6 and 8 The parishes with highest screening rates were mainly in rural areas (St. Charles, St. James, St. Landry, and Acadia) apart from De Soto The parishes with lowest screening rates were Allen and Madison, both of which are in rural areas People in rural areas were more likely to have visited their PCP in 2023 than people in urban areas Though there seems to be no disparity in colorectal cancer screening rates between the rural vs urban regions, access to primary care providers appears to positively influence colorectal cancer screening rates
Background Colorectal cancer (CRC) is 2nd greatest cause of cancer-related death in the United States Colorectal cancer screening (CCS) can identify precancerous polyps, leading to prompt removal, thereby potentially preventing cancer from developing The incidence and mortality rates of CRC have been declining in the United States, likely due to an increase in screening
Types of Colorectal Cancer Screening Stool-based tests Highly sensitive fecal immunochemical test (FIT) every year Highly sensitive guaiac-based fecal occult blood test (gFOBT) every year Multi-targeted stool DNA test with fecal immunochemical testing (MT-sDNA or sDNA-FIT or FIT-DNA)) every 3 years Visual (structural) exams of the colon and rectum Colonoscopy every 10 years Sigmoidoscopy every 5 years CT colonography (virtual colonoscopy) every 5 years
Colorectal Cancer Screening Rates (2023): Males: 3097/7184 (43%) Females: 5384/10782 (50%) Males Females Gender 43% 50% 50% 57%
Age 71-75 50% Age 66-70 49.60% 46-50: 1486/4561 (32.6%) 51-55: 1957/4211 (46.5%) 56-60: 2592/4887 (53.0%) 61-65: 2358/4130 (57.1%) 66-70: 67/135 (49.6%) 71-75: 21/42 (50.0%)* 61-65 57.10% 56-60 53% 51-55 46.50% 46-50 32.60% 0.00% 10.00% 20.00% 30.00% 40.00% 50.00% 60.00% *small sample size Colorectal Cancer Screening Rate
Race/Ethnicity Non-Hispanic/Latino 51.10% Race/Ethnicity Hispanic/Latino 56% American Indian/Alaska Native: 84/163 (51.5%) Asian: 149/273 (54.6%) Black/African American: 4007/8277 (48.4%) White: 3763/7991 (47.1%) Hispanic/Latino: 317/567 (55.9%) Non-Hispanic/Latino: 6725/13159 (51.1%) White 47.10% Black/African American 48% Asian 54.60% American Indian/Alaska Native 51.50% 40.00% 50.00% 60.00% Colorectal Cancer Screening Rate
Colorectal Cancer Screening Rate 70% Primary Languages 58% 58% 60% English: 8237/17531 (47.0%) Spanish: 160/275 (58.2%) Native Hawaiian: 80/137 (58.4%) 50% 47% 40% 30% 20% 10% 0% Native Hawaiian Spanish English Colorectal Cancer Screening Rate
Type of Screening Type of screening Colonoscopy: 6947/7325 (94.8%) Fecal occult blood test: 293/7325 (4.0%) Sigmoidoscopy: 79/7325 (1.1%) CT colonography: 6/7325 (0.1%) Colonoscopy Sigmoidoscopy CT colonography Fecal occult blood test
Screening Test: Colonoscopy vs. Other Tests Gender Age Group 70% 35% 64% 63% 31% 60% 30% 28% 28% 28% 27% 50% 25% 22% 40% 37% 36% 20% 17% 16% 30% 15% 20% 10% 10% 5% 1% 1% 0% 0% 0% 0% Male Female 46-50 51-55 56-60 61-65 66-70 71-75 Colonoscopy Other Tests Colonoscopy Other Tests
Screening Test: Colonoscopy vs. Other Tests Race/Ethnicity Language 99% 97% 90% 100% 80% 77% 80% 90% 70% 80% 60% 48% 48% 44% 43% 50% 70% 40% 60% 30% 20% 50% 4% 3% 2% 2% 10% 1% 1% 40% 0% 30% 20% 10% 2% 1% 1% 0% 0% English Spanish Native Hawaiian Colonoscopy Other Tests Colonoscopy Other Tests
Women were more likely to undergo colorectal cancer screening (CCS) than men in Louisiana in 2023 Age group 45-50 had the lowest compliance rate for CCS Age group 61-65 has the highest compliance rate for CCS Hispanic/Latino was the race with the highest rates of CCS while White was the race with the lowest rates of CCS People who speak Native Hawaiian or Spanish are more likely to get CCS The majority of patients received a Colonoscopy as their screening test Comparing patients who get colonoscopy vs other tests, there was no significant difference between the individual characteristics (gender, age, race/ethnicity, and primary language) Summary
Community Preventive Services Task Force (CPSTF) Recommendations CPSTF recommends multicomponent interventions to increase screening for colorectal cancers Multicomponent interventions consist of two or more intervention approaches reviewed by the CPSTF Two or more intervention approaches from the following strategies: Interventions to increase community demand: client reminders, client incentives, small media, mass media, group education, one-on-one education Interventions to increase community access: reducing structural barriers, reducing client out- of-pocket costs Interventions to increase provider delivery of screening services: provider assessment and feedback, provider incentives, provider reminders The CPSTF recommendation is based on evidence from a systematic review of 88 studies (search period January 2004 - November 2013) Compared with no intervention, multicomponent interventions increased colorectal cancer screening by a median of 15.4 percentage points
ACLA Participation in TACL (Taking Aim at Cancer in Louisiana) Social Media Campaign to bring awareness to colorectal cancer screening Distribution of Louisiana Department of Health Colorectal Cancer Fact Sheet and screening infographics Faith-Based Organization Outreach and Education Cancer Screening Saves Lives event at each Wellness and Opportunity Center to promote cancer screenings $10 for completing colorectal cancer screening for current Care Card Member AmeriHealth Current Initiatives
Recommendations Develop public awareness campaigns to emphasize the importance of colorectal cancer screening for both men and women, with tailored messaging to encourage screening among the 45-50 age group Collaborate with community organizations serving populations with lower screening rates Utilize mobile screening units to bring colorectal cancer screening services directly to underserved communities Work with healthcare facilities across Louisiana to implement quality improvement initiatives aimed at increasing colorectal cancer screening rates and improving the overall quality of screening services.
Thank you! Thank you! Dr. Gregory Randolph Dana Smith Renee Wells Carrie Blades Shea Good Rhonda Baird ACLA Quality Improvement Team
References Sung H, Ferlay J, Siegel RL, et al. Global Cancer Statistics 2020: GLOBOCAN Estimates of Incidence and Mortality Worldwide for 36 Cancers in 185 Countries. CA Cancer J Clin. 2021;71(3):209-249. doi:10.3322/caac.21660 Cronin KA, Lake AJ, Scott S, et al. Annual Report to the Nation on the Status of Cancer, part I: National cancer statistics. Cancer. 2018;124(13):2785-2800. doi:10.1002/cncr.31551 Steele CB, Thomas CC, Henley SJ, et al. Vital Signs: Trends in Incidence of Cancers Associated with Overweight and Obesity - United States, 2005-2014. MMWR Morb Mortal Wkly Rep. 2017;66(39):1052-1058. Published 2017 Oct 3. doi:10.15585/mmwr.mm6639e1 Yang DX, Gross CP, Soulos PR, Yu JB. Estimating the magnitude of colorectal cancers prevented during the era of screening: 1976 to 2009. Cancer. 2014;120(18):2893-2901. doi:10.1002/cncr.28794 Colorectal cancer screening. Colorectal Cancer Screening. (n.d.).https://progressreport.cancer.gov/detection/ colorectal_cancer Guide to Community Preventive Services. Cancer Screening: Multicomponent Interventions Colorectal Cancer. https://www.thecommunityguide.org/findings/cancer-screening-multicomponent-interventions- colorectal-cancer.html. Page last updated: October 8, 2019.
