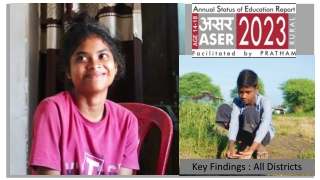
Conservation Districts Survey 2017: Insights & Analysis
"Survey conducted by The National Association of Conservation Districts in 2017 to assess needs & values of Conservation Districts and their relationships with Federal partners. Explore findings on CD profiles, regions, respondents breakdown, and professional backgrounds of participants."

Download Presentation

Please find below an Image/Link to download the presentation.
The content on the website is provided AS IS for your information and personal use only. It may not be sold, licensed, or shared on other websites without obtaining consent from the author.If you encounter any issues during the download, it is possible that the publisher has removed the file from their server.
You are allowed to download the files provided on this website for personal or commercial use, subject to the condition that they are used lawfully. All files are the property of their respective owners.
The content on the website is provided AS IS for your information and personal use only. It may not be sold, licensed, or shared on other websites without obtaining consent from the author.
E N D
Presentation Transcript
The National Association of Conservation District s 2017 Survey of Conservation Districts Breakout Session FRANK B. CLEARFIELD, Ph.D. SOCIAL SCIENCES CONSULTANT JANUARY 2018 NASHVILLE, TN
Survey Goals Establish a baseline Increase NACD s understanding of what CDs value Identify current and future needs of CDs Explore the relationship of CDs with Federal partners
Survey Background Survey ran from October 2 to December 1, 2017 A survey hyperlink and a PDF copy were sent through three email reminders by NACD s Chief Executive Officer Email was sent to 2,436 CDs and 596 responded (24% response rate) Excellent response to a long complicated survey (74 questions) Board members had to conduct research on their budgets, number of cooperators served, budgetary breakdowns, etc. Board members also needed to generally agree on subjective response, which ideally meant collaborations in person, email, phone, etc. A majority of CDs who answered the questionnaire fully completed the survey Because not all CDs responded to the survey, caution needs to be exercised if generalizing to all District s nationally and/or regionally
Presentation Outline Profile of CDs I. II. Cooperators served, budget and funding distribution III. NACD services, communication, and dues IV. Resource concerns and relationship with Federal partners V. Comments, summary and recommendations
NACD Regions NP PAC NE NC SW NE SE SC
Breakdown of respondents by region and states Region Percentage (n=596) State Percentage (n=596) 12 6 6 5 5 4 4 4 0 >10% of CDs in state TX KS KY OH IN OK IA MI NE 6 SE 19 NC 27 SC 20 NP 13 SW 9 PAC 6 7 states 18 states
Professional Backgrounds of CDs (check all that apply) Background Percentage (n=586) Farm/Rancher Owner or Operator/Manager 95 Business Owner 56 Retiree 50 Accounting/Bookkeeper 21 Educator non college 20 Contractor/Developer/Construction 18 Government County/Municipal Level 18 Sales 14
Staffing Breakdown and Averages Percentage Breakdown of CDs who Employ Staff National staff average and categories of staff types 0 1 2 3 or more Average National 6.0 Full-time staff (n=491) 15% 41% 19% 22% Full-time 3.0 Part-time staff (n=440) 34% 44% 12% 9% Part-time 2.0 Contractor(s) (n=308) 73% 18% 5% 4% Contractor 1.0
Job Titles (check all that apply) Percentage 11 Educational Specialist 23 District Administrator 35 District Secretary 36 Conservation Technician 42 District Manager 43 Other (consvist, specist, coord, etc.) 0 5 10 15 20 25 30 35 40 45
CDs are co-located with the following organizations NRCS FSA Not Co- located 14% RD CES Private Other 78% 57% 9% 7% 2% 14% NRCS/FSA/RD 9% NRCS/FSA 55% N= 518 Based on 2,954 CDs, these percentages would translate as follows: 2,300 are co-located with NRCS 1,625 are co-located with NRCS-FSA 265 are co-located with NRCS-FSA-RD 413 are not co-located
Lease/Ownership of Office Space 75% Lease; 19% Own; 6% Own and Lease
II. Cooperators served, budget and funding distribution
Number of cooperators served during last fiscal year Percentage of CDs 45 N=464 42 40 35 30 29 30 25 20 15 10 5 0 0- 75 76-200 201-500 or greater
CDs annual budget Percentage of CDs National Average = $90,000 20 19 19 18 16 14 12 12 11 12 10 10 7 8 5 6 3 3 4 2 0 $0 - 10k $10k - 25k $26k - 50k $51k - 75k $76k - 100k $101k - 250k $251k - 500k $501k - 750k $750k - 1 mil > $1 million N=488
Association between budget, staffing, and number of cooperators served Correlations between a CD s (1) annual budget, (2) number of staff, and (3) the number of cooperators served are significant at least at the .005 level CDs collocated at USDA service centers (NRCS-FSA-RD) had more positive relationships with these three variables than other types of locational situations. Sample size, however, is small
Where do CDs get their budgets? Source Percentage State Government 44 County Government 31 Federal Government 14 Product Sales 13 Fee for Service 13
Federal Funds 14% of CDs funds come from the Federal Government 59% are from Grants 55% are from Cooperative Agreements
Associating funding sources and CDs budgets CDs with lower budgets are associated with state government funding and product sales CDs with higher budgets are associated with funding from Federal sources, Private Funding, and Fee for Services
III. NACD services, communication, and dues
Likert Scale Strongly Agree Agree Neutral Disagree Strongly Disagree Not Applicable or Don t Know 1 2 3 4 5 -
Please rate the USEFULNESS of the following NACD Services - Advocacy Percentage 60 51 N = 341 50 40 30 23 16 20 9 10 2 Percentage 0 Extremely Useful Useful Moderately Useful Somewhat Useful Not at all Useful Mean = 2.2
Please rate the USEFULNESS of the following NACD Services Urban Ag Conservation Grant Initiative Percentage 32 35 N = 210 30 21 25 20 17 20 11 15 10 5 0 Extremely Useful Useful Moderately Useful Somewhat Useful Not at all Useful Mean = 3.0
USEFULNESS of NACD services and communications methods Services/Communication Methods Mean N NA/or DK Advocacy 2.2 341 115 Educational Materials 2.3 414 50 Envirothon 2.4 344 122 eResources (distributed every Tuesday) 2.5 392 66 Conservation Clip List (dist. every Friday) 2.5 416 51 District Operation Training Program 2.5 254 202 Grassroots Messages 2.6 318 129 Policy Position Papers 2.6 316 134 The Resource (distributed quarterly) 2.6 385 69
USEFULNESS of NACD services and communications methods (cont) Services/Communication Methods Mean N N/A or DK Webinars 2.6 329 128 NACD Meetings 2.6 294 158 Soil Health Champions Network 2.7 256 198 Conservation Planning Bootcamp 2.7 239 213 Online Store 2.8 326 129 District Training Recognition Program 2.8 222 231 Forestry Notes 2.8 415 53 Urban Ag Conservation Grant Initiative 3.0 210 238
Satisfaction with NACDs Education and Stewardship programs and future focus Education Programs (N = 355) and Stewardship Programs (369) both were received a mean of 2.3 K-8 is preferred for the focus of future educational programs, but educational programs on all levels would be mostly supported (N = 478)
What do these ratings tell us? CDs gave mostly average ratings to NACD s communication methods and services NACD has many ongoing programs and projects and it may be difficult to focus on all activities CDs expressed themselves by checking the Not Applicable/Don t Know response, which indicates that that service/method may not be useful to the District
Training received by CD Board members over past 3 years (check all that apply) and CD would benefit most from in the future (check one) 26 Responsibilities of CD members & authorities 84 18 Farm Bill & other programs 42 17 Strategic planning 29 Future Training Received 5 Budget/Accounting 26 5 Legal 22 3 Communications 18 0 10 20 30 40 50 60 70 80 90
Which communication method do CDs prefer? Method Percentage of CDs (N = 486) 73 Email (e.g., action alerts from NACD leaders) Electronic publications (e.g., eResources and Conservation) 13 Mail 11 Phone 1 Website 1 Text and/or App .4
How often do CDs prefer receiving communications from NACD? Frequency Percentage of CDs (N = 482) 42 Once weekly Once monthly 35 Multiple times per month 13 Multiple times per week 5 Daily 2 Other (i.e., when necessary, as needed, twice monthly) 4
How frequently do CDs and local work groups meet? Frequency % of Local Work Groups (N = 445) 6 % of CD Boards (N = 513) 0 Never Monthly 96 1 Quarterly 2 2 Semi-annually 0 7 Annually .4 67 As needed 2 17
Factors that influence level of dues CD pays to NACD CD Budget No Invoice DK what CD receives Low Value Mean: 1.8 3.2 2.8 3.2 60 50 40 30 20 10 0 Extremely Influencial Influencial Moderately Influencial Uninfluencial Extremely Uninfluencial
IV. Resource Concerns and Relationship with Federal partners
Resource Concerns by Region WQ Erosion Nut mgmt Erosion Soil H GL WQ Erosion Soil H Erosion WQ Soil H WQ WQT GL Erosion GL SH,WQ, WQT Erosion WQ Soil H National: Erosion & Sediment Control, WQ, Soil H.
Importance of Federal and Farm Bill Programs to your CD Program/Service Mean N Conservation Technical Assistance 1.4 460 Environmental Quality Incentives Program 1.4 456 Conservation Stewardship Program 2.0 442 EPA 319 NPS Grants 2.2 376 Conservation Reserve Program (CREP) 2.2 400 Emergency Watershed Protection Program 2.2 403
Please rank the strength of your Districts relationship with NRCS District Conservation/Technical Staff who serve your CD Percentage 49 N = 506 50 45 40 33 35 30 25 20 13 15 10 4 1 5 0 Extremely Strong Strong Average Weak Extremely Weak *CDs collated with any Federal organization rated this relationship even more positively Mean = 1.8
Ratings of USDA service centers by CDs Service Mean N Administrative Services 1.9 373 Agency/District Coordination 1.9 494 Internet Services 2.0 368 Outreach Materials 2.2 453 Staff Training 2.3 409
Which Federal resource tools are used by your CD (assume staff members) (select all that apply) 77% AgLearn 74% NRCS Web Soil Survey 54% Electronic Field Office Technical Guide (eFOTG) 49% Toolkit 34% National Conservation Practice Standards (NCPS) 31% Protracts
Identify Joint Operations your CD has with USDA (select all that apply) 81% Telephone or Internet access 67% Equipment sharing (vehicles, computers, etc.) 41% Lease agreement 15% Other (i.e., office space, agreements, supplies, etc.
V. Comments, Summary and Recommendations
Comment Page Training, training, training CDs want explanations of what NACD does and how it helps them Agriculture is changing. CDs need an understanding of how to market CDs to urban/suburban areas CDs need information about ALL Federal programs (not just Farm Bill and agricultural programs) and how to apply and be selected for these programs (N = 83)
Summary CDs profile Most Board members of CDs are farmers/ranchers, business owners, and retirees National average number of staff is 6: 3 full time, 2 part- time, and 1 contractor Over 3/4s of CDs are co-located with NRCS and more than half with both NRCS and FSA
Summary cooperators served, budget, and funding distribution On a national basis, positive relationships exist between higher CD budgets, larger number of staff, and a larger number of cooperators served CDs collocated with NRCS-FSA-RD have more positive relationships with above variables than any other locational situation CDs receive their budgets mostly from State and County governments
Summary NACD services, communications, and dues Ratings of the usefulness of only a few NACD services/communication methods are better than average NACD has many programs and projects and many CDs are unfamiliar with all NACD s activities Training received and training desired is in sync A CD s budget has the most influence on dues paid to NACD
Summary Resource concerns and relationship with Federal partners CTA and EQIP are view as the most important Federal programs CDs have a strong relationship with NRCS s local field staff; those CDs collocated with Federal agencies rate the relationship more positively CDs rate USDA service centers highest in Administrative Services, Agency/District coordination and Internet Services, but average in outreach materials and staff training. Conversely, CDs selected AgLearn as the most used Federal resource tool used by staff
Recommendations CDs would like to know what NACD does with their annual dues. NACD should regularly communicate their activities along with information on NACD budget priorities. 1. a. NACD performs multiple activities that CDs either don t have a use for or are unfamiliar with. NACD should consider focusing their activities to produce high quality services and provide frequent updates. NACD should especially focus on its advocacy efforts, educational guidance/materials, and training CDs want more training in (1) Responsibilities of CD Board members and CD authorities; (2) Farm Bill and Agricultural Programs; and (3) Strategic Planning. NACD may need to devote resources to develop and execute training as well as coordinating with NRCS and FSA to ensure AgLearn, or other training vehicles, have courses targeted for CDs 2.
Recommendations CDs need effective marketing and outreach materials. This information should include how to raise awareness of a CD s activities to urban and suburban audiences as well as marketing CDs to nontraditional agricultural and non-agricultural groups Since budgets of CDs seem to be a linchpin for generating more local district staff, and serving more cooperators, NACD could offer tips/guidance/training on how CDs can increase their budgets. Information should cover all available sources 3. 4. a. NACD could enlist those CDs who are effective at acquiring funds from multiple sources to provide advice and guidance to other CDs
Recommendations Communication methods Most CDs would like their information from NACD through weekly emails and electronic publications. However, a little over 10% would like information delivered through the mail. To minimize costs, NACD needs to find out which CDs want mailings and send only these CDs information through the post office. Future educational programs should focus on K-8 5. 6. CDs seem to perform more positively when they are collocated with USDA agencies. NACD can lend support to this type of collocation, but, at the same time, support those CDs that have credible reasons for being solely located 7.
Questions, Comments, Observations Contact Information Frank Clearfield Social Sciences Consultant frank.clearfield@gmail.com 617-955-6093


")