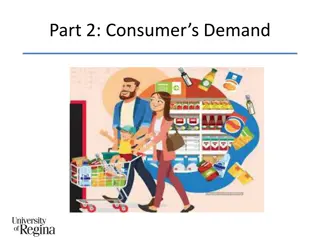
In Chapter Eight, delve into the intricacies of consumption patterns, budget lines, utility functions, and societal impacts of consumer behavior. Explore the effects of income changes, price fluctuations, and advertising expenditures on consumer choices. Analyze ecological footprints, subjective well-being, and income disparities across countries. Gain insights into the dynamic relationship between consumption and economic well-being.
Please find below an Image/Link to download the presentation.
The content on the website is provided AS IS for your information and personal use only. It may not be sold, licensed, or shared on other websites without obtaining consent from the author. If you encounter any issues during the download, it is possible that the publisher has removed the file from their server.
You are allowed to download the files provided on this website for personal or commercial use, subject to the condition that they are used lawfully. All files are the property of their respective owners.
The content on the website is provided AS IS for your information and personal use only. It may not be sold, licensed, or shared on other websites without obtaining consent from the author.
Table 8.1 Table 8.1 Quong s Quong s Utility from Consuming Chocolate Bars Utility from Consuming Chocolate Bars
Figure 8.4 Figure 8.4 Quong s Quong s Utility Function for Chocolate Bars Utility Function for Chocolate Bars
Figure 8.5 Revolving Debt in the United States, 1968 Figure 8.5 Revolving Debt in the United States, 1968- - 2017, Adjusted for Inflation 2017, Adjusted for Inflation Sources: Federal Reserve, Consumer Credit (G.19); CPI data from the Bureau of Labor Statistics.
Figure 8.8 The Relationship Between Average Income and Figure 8.8 The Relationship Between Average Income and Average Subjective Well Average Subjective Well- -Being Across Countries, 2016 Being Across Countries, 2016 Source: Helliwell et al., 2017.