Consumption Decisions and Economic Impact
In Chapter 4, the focus is on consumption decisions and their economic implications. The content covers topics such as budget lines, effects of income changes and price fluctuations, utility from consuming chocolate bars, and ecological footprints per capita in select countries. Various figures and tables provide visual aids to enhance understanding of the concepts discussed. The chapter delves into how individuals make choices based on limited resources and the impact of these decisions on the economy and sustainability. Through detailed analysis and examples, readers gain insights into the dynamics of consumption behavior and its broader implications.
Download Presentation

Please find below an Image/Link to download the presentation.
The content on the website is provided AS IS for your information and personal use only. It may not be sold, licensed, or shared on other websites without obtaining consent from the author.If you encounter any issues during the download, it is possible that the publisher has removed the file from their server.
You are allowed to download the files provided on this website for personal or commercial use, subject to the condition that they are used lawfully. All files are the property of their respective owners.
The content on the website is provided AS IS for your information and personal use only. It may not be sold, licensed, or shared on other websites without obtaining consent from the author.
E N D
Presentation Transcript
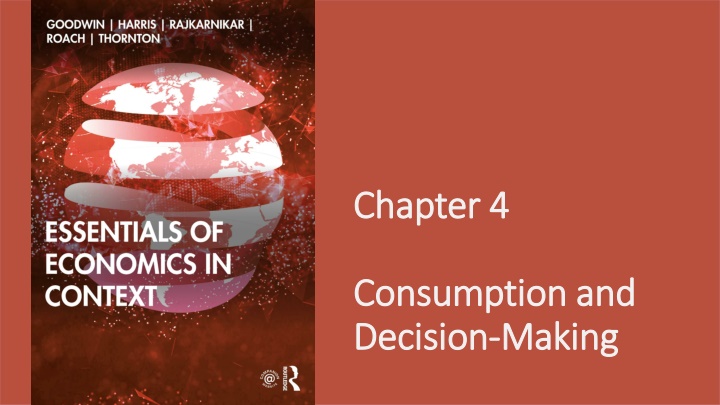
Chapter 4 Chapter 4 Consumption Consumption and Decision Decision- -Making and Making
Figure 4.1 The Budget Line Figure 4.1 The Budget Line
Figure 4.2 Effect of an Increase in Income Figure 4.2 Effect of an Increase in Income
Figure 4.3 Effect of a Fall in the Price of One Good Figure 4.3 Effect of a Fall in the Price of One Good
Table 4.1 Table 4.1 Quong s Quong s Utility from Consuming Chocolate Bars Utility from Consuming Chocolate Bars
Figure 4.4 Figure 4.4 Quong s Quong s Utility Function for Chocolate Bars Utility Function for Chocolate Bars
Figure 4.5 Ecological Footprint per Capita, Select Countries, 2016 Figure 4.5 Ecological Footprint per Capita, Select Countries, 2016 Source: Global Footprint Network, 2019.
