Contribution of VCSE Sector to Health in Humber and North Yorkshire
Explore the detailed report findings on the VCSE sector's impact on health and wellbeing in Humber and North Yorkshire. Discover insights on the sector's size, value, and contribution to addressing health inequalities and geographical disparities in the region.

Download Presentation

Please find below an Image/Link to download the presentation.
The content on the website is provided AS IS for your information and personal use only. It may not be sold, licensed, or shared on other websites without obtaining consent from the author. If you encounter any issues during the download, it is possible that the publisher has removed the file from their server.
You are allowed to download the files provided on this website for personal or commercial use, subject to the condition that they are used lawfully. All files are the property of their respective owners.
The content on the website is provided AS IS for your information and personal use only. It may not be sold, licensed, or shared on other websites without obtaining consent from the author.
E N D
Presentation Transcript
How to use this slide deck (Not to be presented) This slide deck is not intended to be presented in its entirety, more as a tool to draw data from, including tables and figures to support your presentation. You ll find additional information in the notes section on the slides where context is needed, and please refer to the full report or summary report if you would like further information. Please get in touch with anna.boad@yorkcvs.org.uk if you require any additional slides. Full Report - https://www.stchads.ac.uk/wp-content/uploads/2022/03/The-contribution-of-the- VCSE-sector-to-health-and-wellbeing-in-Humber-Coast-and-Vale-February-2022.pdf Summary Report - https://www.stchads.ac.uk/wp-content/uploads/2022/03/Summary-report- The-contribution-of-the-VCSE-sector-to-health-and-wellbeing-in-Humber-Coast-and-Vale- February-2022.pdf
VCSE Collaborative The Contribution of the VCSE Sector to Health and Wellbeing in Humber and North Yorkshire - Report Findings 2022
Background: The Contribution of the VCSE Sector to Health and Wellbeing in Humber and North Yorkshire report was commissioned by the Humber and North Yorkshire Health and Care Partnership and the VCSE Collaborative to understand more about the sector and how our geography and the places that make up Humber and North Yorkshire are served. Professor Tony Chapman, St Chad s College, Durham University has worked with the VCSE Collaborative to complete an initial look at the size, scale and value of the sector, and the contribution it makes in relation to the health and wellbeing of our people. The findings within this report begin to plot the VCSE sector alongside the differences we see across Humber and North Yorkshire in terms of deprivation, health inequalities and our geography.
The VCSE Sector in local context Area profile of Humber and North Yorkshire Distribution of VCSE organisations
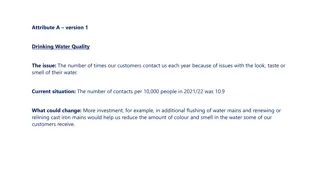
Patterns of deprivation The table shows the wide disparities in affluence across Humber and North Yorkshire. Long-term employment is a strong indicator of income deprivation.
Patterns of life expectancy The life expectancy of males and females tends to be much higher in more affluent areas. This tends to produce a higher concentration of people over the age of 85 in more affluent areas which in turn may shape patterns of demand for health and social care support.
Healthy life expectancy at birth Health life expectancy is highest in North Yorkshire at 67 for females and 65 for males.
Life expectancy and healthy life expectancy at birth
Personal wellbeing Levels of personal wellbeing are shaped by the living conditions of individuals. Affluence or deprivation has an impact on levels of demand for services in localities. For example, overcrowding in houses tends to be more prevalent in the less affluent areas of Hull (8%) and Scarborough (6%), but also in York which has significant pockets of deprivation together with high levels of demand for urban accommodation.
Personal wellbeing Levels of personal wellbeing are shaped by the living conditions of individuals. Fuel poverty is almost equally common across all areas, running between 8% and 12%. Variations in the percentages of older people living alone range between 27% and 32% in all areas apart from Hull where 37% of older people live alone. This indicates that support for socially isolated people may be high across the whole of Humber and North Yorkshire.
Diversity *English Indices of Deprivation (IMD) 2019
Diversity Patterns of social diversity can shape levels of demand for services. The situation in Humber and North Yorkshire is quite complex. The highest concentration of none White UK residents are in Hull, York, Harrogate and North Lincolnshire. The Black, Asian and Minority Ethnic population tends to be quite low in Humber and North Yorkshire compared with other parts of Yorkshire.
Distribution of Voluntary, Community and Social Enterprise (VCSE) Sector organisations
VCSE organisations across Humber and North Yorkshire There are an estimated 13,512 VCSE organisations operating across Humber and North Yorkshire. The majority of VCSE organisations in Humber and North Yorkshire are registered charities, but about a quarter are organisations with other legal forms, such as Community Interest Companies (CICs) and Cooperatives, and Community Benefit Societies (CCBS). Unregistered organisations, associations, societies and groups could number over 7,500 across Humber and North Yorkshire.
Distribution of VCSE organisations Table 2.6 Estimated number of VCSE organisations and groups in Humber and North Yorkshire
VCSE organisations in North Yorkshire
VCSE organisations in North Yorkshire by size Table 2.8 Number of VCSEs by size
Percentage of VCSE organisations in rural and urban areas
VCSE organisations in rural and urban areas In urban areas there is a much larger proportion of larger or big VCSE organisations (14%) when compared with market towns (4%) or rural areas (5%). In rural areas there is a much larger proportion (57%) of very small micro VCSE organisations (with annual income below 10,000). These variations will have a substantial impact on the extent to which the local VCSE sector has the capacity to tackle specific activities.
VCSE organisations in coastal areas In the Humber and North Yorkshire Health and Care Partnership area, there is a concern that local needs may be particularly pronounced in coastal areas. 61 wards were identified as coastal areas (Figure 2.6)
VCSE organisations in coastal areas VCSE sector structure appears to be broadly similar in coastal and inland areas. However, there is a larger number of VCSE organisations with income above 250,000 in coastal areas which has a significant bearing on overall sector resources. In coastal areas, nearly 32% of VCSE organisations are located in the poorest quintile of deprivation compared with just 4% in non-coastal areas. Only 5% of VCSE organisations in coastal areas are located in the most affluent areas compared with 33% in inland areas.
VCSE organisations in coastal areas These wide variations in VCSE organisational location are due to the geographical characteristics of coastal and non-coastal areas. Figure 2.9 shows that 69% of VCSE organisations in coastal areas are located in urban areas compared with just 43% in non- coastal areas.
VCSE Sector Capacity Income Employees Volunteers Interactions
VCSE Sector Capacity across Humber and North Yorkshire In 2020, the VCSE sector in Humber and North Yorkshire had an income of nearly 1billion and expenditure of 948 million. Income and expenditure is not distributed evenly across the sector. The biggest organisations command the largest share of the sector s income.
VCSE Sector Capacity across Humber and North Yorkshire The distribution of VCSE organisations in local authority areas varies considerably with bigger organisations based mainly in larger urban areas. This has a significant impact on the average income of VCSE organisations in local authorities and districts.
VCSE Sector Employees Humber and North Yorkshire Around 23,200 VCSE sector employees deliver 38 million hours of work annually. The staff costs of VCSE organisations amount to 613 million. There are significant variations in the number of employees in local authorities due to differences in the size of organisations in those areas. Average numbers of employees tend to be much higher in the urban areas of Harrogate, York, Hull and North East Lincolnshire.
VCSE Sector Volunteers Humber and North Yorkshire It s estimated that around 128,000 volunteers provide 9 million hours of work which represents about 25% of additional resource to the sector. The replacement cost of this work would amount to between 80 million and 125 million if delivered by paid employees. There are many more regular volunteers in more affluent districts of North Yorkshire and York. Levels of regular volunteering for VCSE organisations in North and North East Lincolnshire and Hull are much lower.
Contribution of employees and volunteers in North Yorkshire
Energy invested by VCSE Sector Employees and Volunteers
VCSE Sector Interactions Figure 3.6 Variations in the extent to which VCSE organisations work within or across spatial boundaries in Humber and North Yorkshire (Third Sector Trends, North of England, n=2,935)
VCSE Sector Interactions 80% of VCSE organisations stated that they have useful informal relationships with other voluntary organisations and groups and a further 7% show a willingness to do so in the future. Nearly 70% of organisations work quite closely, but informally, with other voluntary organisations and groups, and about 12% more show an interest in doing so in future. Fewer VCSE organisations work in formal partnership arrangements - only 30 per cent do so, but many more are considering this prospect (around 21%)
VCSE Sector Interactions Grants and Contracts Formal relationships are often forged when VCSE organisations are working on bids for grants and contracts but general interest in partnership bidding, and the percentage of successful VCSE organisations has fallen from 21% to 17%. The percentage of VCSE organisations which have been successful in winning partnership bids fell from 21% in 2013 to 15% in 2019. VCSE organisations which are not considering the prospect of partnership bidding rose from 47% in 2013 to 64% in 2019. This could be due to the size of organisations as larger organisations are much more likely to be interested in or successfully delivering contracts.
Engagement with Health and Wellbeing
Public Health Related Issues Table 4.1 Percentage of charities engaging with public health related issues in Humber and North Yorkshire (Charity Commission Register data 2021)
Public Health Related Issues VCSE Impact Many VCSE organisations feel that they make a strong or important contribution to public health by addressing issues such as: Health and Wellbeing 61% Giving people the confidence to manage their lives 45% Tackling Social Isolation 59% Improving access to basic services 30%
Figure 4.1 Humber and North Yorkshire Health and Care Partnership area - VCSE organisations' perceptions of impact (Third Sector Trends 2019) Public Health Related Issues VCSE Impact
Meeting critical personal and social needs Across Humber and North Yorkshire, the VCSE sector is structured in such a way as to meet critical local needs. This means that there tends to be a concentration of provision in areas where needs are greatest. There is a concentration of VCSE capacity in urban and poorer areas to meet critical needs , while provision for aspects of personal and social development is higher in rural and more affluent areas.
Meeting critical, personal and social needs Table 4.3 Percent of charities working in domains of social benefit (Charity Commission Register 2021) Health Disability Poverty Housing Sport and Recreation 31.1 Arts and Heritage 23.4 Diversity Number of charities 222 Richmondshire 6.3 6.3 8.1 4.1 0.5 Harrogate 9.7 11.4 10.2 3.9 24.7 25.8 1.2 596 Hambleton 7.7 11.3 9.3 2.8 28.3 22.4 1.0 389 Ryedale 7.6 8.4 8.4 2.5 29.1 22.9 0.7 275 Selby 8.0 9.4 11.3 2.4 22.6 13.2 1.4 212
Meeting critical, personal and social needs Table 4.3 Percent of charities working in domains of social benefit (Charity Commission Register 2021) Health Disability Poverty Housing Sport and Recreation 13.9 Arts and Heritage 16.0 Diversity Number of charities 563 York 13.3 13.5 17.9 6.2 3.0 East Riding of Yorkshire Kingston upon Hull North Lincolnshire North East Lincolnshire 11.1 13.0 12.5 3.8 27.2 19.8 1.8 849 18.5 22.2 21.1 8.8 19.1 16.8 5.7 351 12.5 12.9 12.5 2.7 27.1 17.6 1.0 295 17.2 18.4 16.7 8.6 23.0 19.0 1.7 174
Perceptions of Social Impact Assessments of impact tend to be much stronger amongst VCSE organisations based in the poorest areas (with the exception of impact on enhancing the cultural and artistic life of the community and improving the local environment). More than twice as many VCSE organisations based in the poorest areas (41%) feel that they have a strong impact on giving people confidence to manage their lives as in the richest areas (17%). Almost twice as many VCSE organisations based in the poorest areas (37%) perceive that they have a strong impact on social isolation compared with 21% in the most affluent areas.
Report Summary Area Profile The report demonstrates that there are wide disparities in affluence across Humber and North Yorkshire. The differences between areas can be stark and these disparities are reflected in health and wellbeing statistics. Levels of healthy life expectancy are affected and there are higher levels of long-term limiting illnesses in poorer areas. Differences are masked to some extent due to variations in population profiles e.g. there are higher concentrations of people over the age of 85 in more affluent areas which shapes patterns of local demand for health and social care support. Areas of affluence or deprivation and geographical location impact on levels of demand for vital services from VCSE organisations.
Report Summary VCSE Capacity There are approximately 5,900 registered VCSE organisations in Humber and North Yorkshire with an estimated 7,600 unregistered groups. The structure of the VCSE sector differs across areas. In most rural areas, there is a much higher proportion of small organisations. While in more urban areas there is a concentration of larger VCSE organisations. The number of VCSE organisations is shaped by levels of local affluence or deprivation. In the richest areas there are 2.8 VCSE organisations per 1,000 population whereas in the poorest areas, there are only 1.5 but these tend to be larger VCSE organisations meeting aspects of critical need.
Report Summary VCSE Resources There are 28,800 full-time equivalent employees and volunteers in the VCSE sector in Humber and North Yorkshire, providing 47 million hours of work annually. The number of volunteers per 1,000 resident population varies by area. There are bigger concentrations of regular volunteers in more affluent areas. In 2020, the VCSE sector in Humber and North Yorkshire had an income of nearly 1billion and expenditure of 948 million. Income and expenditure are not distributed evenly across the sector.
Report Summary Sector Interactions In Humber and North Yorkshire, around 80% of VCSE organisations have useful informal relationships with other voluntary organisations and groups and about a further 7% show a willingness to do so in future. Success and interest in partnership bidding for grants or contracts has declined from 21% in 2013 to 15% in 2019. The steepest decline appears to be amongst medium-sized VCSE organisations with income between 250,000 and 1million. In the largest VCSE organisations, participation in contract delivery has remained broadly similar.
Report Summary VCSE Activity There is a close relationship between area affluence and the extent to which local VCSE organisations engage in different types of service provision. Provision to meet critical social needs is concentrated in more deprived areas where demand is the greatest. In more affluent areas, there is a stronger emphasis on the promotion of personal and social development needs. For example, sport and recreation activities are more prevalent in affluent areas.
Report Summary Discussion Points There is a shifting emphasis toward reducing demand for critical services in health care systems by focusing resources effectively on preventative measures (using data on healthy life expectancy) There needs to be a clear distinction and understanding between buying services (usually from larger VCSE organisations to deliver tangible and measurable outcomes) and investing in VCSE sector activities that deliver soft outcomes .
Report Summary Discussion Points The willingness of VCSE organisations to join debates about local priorities and securing their commitment to contribute towards strategic plans is shaped by their priorities, the scale of their resources and spatial range of their activities. The evidence suggests that systematic and consistent area-wide strategic plans to work collaboratively with the VCSE sector, if too strictly defined, would be difficult to achieve. It is recommended that distinctions are drawn between formal contractual approaches to collaborative working to deliver harder outcomes and investing in less formal complementary approaches to working to achieve softer outcomes .
Report Summary Discussion Points In the field of health and social care VCSE organisations have often led the way in identifying beneficiary needs that had been neglected by public bodies and devised pioneering ways of addressing problems. Often this has led to support for specific health conditions being brought into the mainstream of public health provision. The VCSE sector plays an important role in shaping policy priorities rather than just responding to them. To bridge the gap between higher level and local level debate, infrastructure organisations can help facilitate discussion across the whole sector.
Report Summary Discussion Points The key thing to remember is that all VCSE activities tend to have some things in common. They bring people together who might not otherwise interact with each other, they give people things to think about and look forward to, they encourage at some level or another physical activity and mental acuity, and they make communities feel like good places to live. Such activities cannot, on their own, solve intractable problems associated with social deprivation but those communities which have a lot of social activity going on tend to be healthier and more confident places.