Convergence of Traffic Assignments in Feedback
This annotated document explores the topic of determining the adequate convergence level for traffic assignments used in feedback systems. It includes studies and analyses presented at conferences, research findings, comparisons of different models, and discussions on aspects like link volumes, trip lengths, and convergence progress in transportation planning applications. Various metrics, models, and statistics are discussed in relation to achieving stability and accuracy in traffic assignments.
Download Presentation

Please find below an Image/Link to download the presentation.
The content on the website is provided AS IS for your information and personal use only. It may not be sold, licensed, or shared on other websites without obtaining consent from the author.If you encounter any issues during the download, it is possible that the publisher has removed the file from their server.
You are allowed to download the files provided on this website for personal or commercial use, subject to the condition that they are used lawfully. All files are the property of their respective owners.
The content on the website is provided AS IS for your information and personal use only. It may not be sold, licensed, or shared on other websites without obtaining consent from the author.
E N D
Presentation Transcript
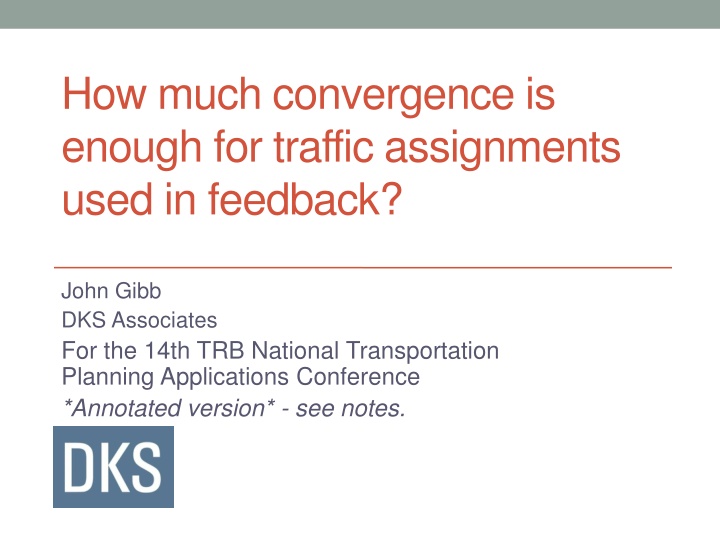
How much convergence is enough for traffic assignments used in feedback? John Gibb DKS Associates For the 14th TRB National Transportation Planning Applications Conference *Annotated version* - see notes.
Partners, Sources, Assistance Sacramento Area Council of Governments Puget Sound Regional Council John Bowman, Mark Bradley, RSG Carson Area Metropolitan Planning Organization Spokane Regional Transportation Council Citilabs PTV America Caliper Inro Consultants
Convergence of traffic assignments: How much is enough? David Boyce Biljana Ralevic-Dekic Hillel Bar-Gera ASCE Journal of Transportation Engineering 130, 49-55 (2004) Link flow stability avoid random noise Relative gap 0.0001
The rest of the assignments Skims Skims Skims Skims Demand model Demand model Demand model Demand model Assignment Assignment Assignment Assignment Link volumes Link times Link times Link times
Skim comparison statistics Extreme absolute difference Average trip length Iteration vs. Preceeding Iteration vs. Equilibrium RMS Average trip length Average absolute difference Average trip length Used paths vs. Shortest path= Relative Gap
Convergence Progress of a Trip-Based Model AM Skim Change 1 Relative Average Skim Change 0.1 RG 0.05 RG 0.01 0.01 RG 0.003 RG 0.001 0.001 RG 0.0004 RG 0.0002 0.0001 2 3 4 5 6 7 8 9 10 11 12 13 14 15 Iteration (demand model)
Convergence Progress of a Trip-Based Model AM Displaced Trips 1 Relative Displaced Trips 0.1 RG 0.05 RG 0.01 0.01 RG 0.003 RG 0.001 0.001 RG 0.0004 RG 0.0002 0.0001 2 3 4 5 6 7 8 9 10 11 12 13 14 15 Iteration (demand model)
Convergence Progress of draft Sacramento Activity-Based Model 1 Relative Avg-Absolute Skim Delta from ev2 h05 h06 h07 h08 h09 h14 h15 h16 h17 md4 ni9 Max RelGap Rel Gap Criterion Period of Day 0.1 previous iteration; Relative Gap 0.01 0.001 0.0001 2 3 4 5 6 7 8 9 10 Demand Model Iteration (during newest skim)
Skim error study Trip Table & Network Well- Poorly- converged assignment Less- converged assignment converged assignment Skim Skim Skim Comparison statistics Comparison statistics
Skim comparison: unconverged vs. best equilibrium 100 Skim at indicated Relative Gap 80 60 RG 0.016 RG 0.0012 40 20 0 0 20 40 60 80 100 Best Equilibrium Skim (min)
Skim Error v. Relative Gap: Sacramento AM (F-W) 1 0.1 Extreme 0.01 Relative Skim Error RMS 0.001 Average-Absolute 0.0001 0.00001 0.000001 0.0000001 0.000001 0.00001 0.0001 0.001 0.01 0.1 1 Relative Gap (posterior)
Skim Error v. Relative Gap: Sacramento Mid-Day 1 0.1 Extreme 0.01 Relative Skim Error RMS 0.001 Average-Absolute 0.0001 0.00001 0.000001 0.0000001 0.000001 0.00001 0.0001 0.001 0.01 0.1 1 Relative Gap (posterior)
Skim Error v. Relative Gap: Reduced congestion (AM) 1 0.1 Extreme 0.01 Relative Skim Error RMS 0.001 Average-Absolute 0.0001 0.00001 0.000001 0.0000001 0.000001 0.00001 0.0001 0.001 0.01 0.1 1 Relative Gap (posterior)
Skim Error v. Relative Gap: Increased congestion (AM) 1 0.1 Extreme 0.01 Relative Skim Error RMS 0.001 Average-Absolute 0.0001 0.00001 0.000001 0.0000001 0.000001 0.00001 0.0001 0.001 0.01 0.1 1 Relative Gap (posterior)
Skim Error v. Relative Gap: BPR^8(AM) 1 0.1 Extreme 0.01 Relative Skim Error RMS 0.001 Average-Absolute 0.0001 0.00001 0.000001 0.0000001 0.000001 0.00001 0.0001 0.001 0.01 0.1 1 Relative Gap (posterior)
Skim Error v. Relative Gap: Visum (Spokane) 1 0.1 Extreme 0.01 Relative Skim Error RMS 0.001 Average-Absolute 0.0001 0.00001 0.000001 0.0000001 0.000001 0.00001 0.0001 0.001 0.01 0.1 1 Relative Gap (posterior)
Skim Error v. Relative Gap: TransCAD (Carson City) 1 0.1 Extreme 0.01 Relative Skim Error RMS 0.001 Average-Absolute 0.0001 0.00001 0.000001 0.0000001 0.000001 0.00001 0.0001 0.001 0.01 0.1 1 Relative Gap (posterior)
Convergence Progress of a Trip-Based Model AM Average Skim Change 1 0.1 Relative Skim Change RG 0.05 RG 0.01 0.01 RG 0.003 RG 0.001 0.001 RG 0.0004 RG 0.0002 0.0001 2 3 4 5 6 7 8 9 10 11 12 13 14 15 Iteration (demand model)
Skim Error, AM changes v. Relative Gap 1 Extreme 0.1 RMS Relative Skim Error 0.01 Average-Absolute 0.001 0.0001 0.0001 0.001 0.01 0.1 1 Relative Gap (posterior)
Convergence Progress of a Trip-Based Model Mid-Day Avg. Skim Change 1 AM 0.05 AM 0.01 AM 0.003 AM 0.001 AM 0.0004 AM 0.0002 RG 0.05 RG 0.01 RG 0.003 RG 0.001 RG 0.0004 RG 0.0002 0.1 Relative Skim Change 0.01 AM 0.001 0.0001 Mid-Day 0.00001 2 3 4 5 6 7 8 9 10 11 12 13 14 15 Iteration
Skim Error, MD changes v. Relative Gap 1 Extreme 0.1 RMS Relative Skim Error 0.01 Average-Absolute 0.001 0.0001 0.00001 0.00001 0.0001 0.001 Relative Gap (posterior) 0.01 0.1 1
Conclusions Relative Gap seems to imply relative skim errors. Successive skim differences can be misleading less than skim error implied by RG esp. in low congestion. Choose Relative Gaps to create small skim errors compared to skim changes. Low RGs don t seem to accelerate demand convergence, but high RGs limit it. Doing so should avoid the misleading-differences problem. This is a small study of a few models. Test your own!
Convergence Progress of draft Sacramento Activity-Based Model 1 ev2 h05 h06 h07 h08 h09 h14 h15 h16 h17 md4 ni9 Max RelGap Rel Gap Criterion Expected Error Relative Change, Error, Gap 0.1 0.01 0.001 0.0001 2 Demand Model Iteration (during newest skim) 3 4 5 6 7 8 9 10
Contact John Gibb jag (at) dksassociates (dot) com
Skim comparison statistics Relative Gap (links) ? = link cost ? = link flow ? = virtual shortest-path flow ?(?? ??) ??? ? = demand (trip table) ?? = used-paths average travel time ?? = shortest-path skim travel time ?? = equilibrium travel time (skims) ??(??? ???) ????? Average Absolute (trip-weighted) ??? ?? ?? ????? RMS (trip-weighted) 2 ??? ?? ?? ??? ??? ???? ????? Max Absolute max???? ?? ??? ???? ?????
