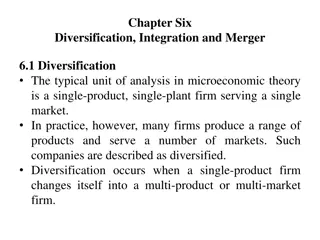
Corporate Level Strategy and Diversification in Tourism
Explore corporate level strategy, mergers & acquisitions, blue ocean strategy, market development, and diversification in the tourism and hospitality industry. Learn about creating value through related and unrelated diversification, the role of corporate headquarters, and strategies for competing in different product markets.

Download Presentation

Please find below an Image/Link to download the presentation.
The content on the website is provided AS IS for your information and personal use only. It may not be sold, licensed, or shared on other websites without obtaining consent from the author.If you encounter any issues during the download, it is possible that the publisher has removed the file from their server.
You are allowed to download the files provided on this website for personal or commercial use, subject to the condition that they are used lawfully. All files are the property of their respective owners.
The content on the website is provided AS IS for your information and personal use only. It may not be sold, licensed, or shared on other websites without obtaining consent from the author.
E N D
Presentation Transcript
ENERGY SAVINGS ASSISTANCE PROGRAM PROGRESS REPORT PUBLIC MEETING 1
SCG Rules-Suspended Area* (RSA) SoCalGas Territory RSA *The Rules-Suspended Area (RSA) is the geographic region designated for intensification through the suspension of Go-Back and 3MM rules as ordered in D.16-04-040 consisting of Ventura County, Orange County, and the Los Angeles Basin. 2
SCG RSA Intensification Timeline Rules-Suspension Launch 6-10-16 Prioritization Adjustment 8-28-16 D.16-04-040 Directs ESA Program Intensification 4-28-16 Focus on total energy savings increase Focus on near-term energy savings May April June July August September Information Technology Enhancements 3
Treated Homes in Designated RSA May-September 2016 Rules-Suspended Enrollments Total Rules- Suspended Enrollments Traditional Enrollments Total Treated <3MM Go-Backs May 3,306 3,306 June 9 4 13 1,954 1,967 July 87 182 269 2,752 3,021 August 41 1,179 1,220 1,547 2,767 September 16 1,383 1,399 835 2,234 Total May- Sep 153 2,748 2,901 10,394 13,295 4
Energy Savings in Designated RSA May-September 2016 Therms Go- Backs Total Rules- Suspended Traditional Enrollments <3MM Total May 0 0 0 52,515 52,515 June 86 36 122 28,880 29,001 July 471 2,093 2,564 42,144 44,708 August 364 13,820 14,184 25,717 39,901 September 152 16,956 17,108 14,201 31,309 Total May- Sep 1,072 32,908 33,977 163,457 197,433 5
SCG Intensification/RSA Activity Therms Saved* Treated SCE Joint Expenditures June 13 11 122 $4,977 July 269 106 2,564 $123,057 August 1,220 794 14,184 $666,641 September 1,399 798 17,108 $783,914 YTD 2,901 1,709 33,978 $1,578,589 *First-year of therm savings of installed measures. 6
SCG Intensification/RSA Expenditures ($) Energy Efficiency Information Technology Marketing & Outreach Total $95,445 May - $95,445 - $19,166 June $4,977 - $14,189 $124,350 July $123,057 - $1,293 $677,908 August $666,641 - $11,267 $797,842 September $783,914 - $13,928 YTD $1,578,589 $95,445 $40,677 $1,714,711 7
SCG Progress Toward 10% Energy Savings Increase Goal RSA Energy Savings (Therms) 2015 2016 Since D.16-04-040 Feb Mar Apr May Jun Jul Aug Sep Oct Nov Dec Total Monthly Average 18,666 70,299 52,920 65,434 76,791 71,682 58,780 52,208 54,835 50,445 98,477 670,537 55,878 May Jun Jul Aug Sep Total May- September Monthly Average 52,515 29,001 44,708 39,901 31,309 197,433 39,487 2016 May-Sep monthly average 29% below 2015 8
SCG Progress Toward 3% Energy Savings On Average for RSA Avg. savings for rules-suspended units 2016 YTD Avg. energy usage for CARE customers in the RSA 33,980 Therms* _____________ 321 Therms /Year /Home = 11.7 Therms /Year /Home 2,903 Treated Homes 3.6% Average Energy Savings * Installed first-year savings 9
ESA Program Intensification Marketing and Outreach High Efficiency (HE) Clothes Washers Follow-up messaging to customers assessed for HE washers but can t reach . Contacted 5,500+ customers, more than half in the rules suspended area. High Energy User Targeted Direct Mail Direct mail targeted to over 5,700 high energy user customers 10
ESA Program Intensification - Marketing and Outreach Direct Mail: Deployed over 100,000 direct mailings June through September More than 60,000 joint-utility letters in SCE/SoCalGas RSA ZIP codes Nearly 40,000 customer letters with coordinated canvassing lists provided to contractors More than 5,700 customer letters targeted to high energy users Email: More than 24,000 emails Website: Updated SoCalGas.com SoCalGas Newsletter: Over 1,800,000 people received electronic newsletter with intensification messaging Bill Inserts/Bill Messages: Deployed bill inserts to over 233,000 customers; bill messages on over 233,000 customer bills. Media: June 2016, issued press release on SoCalGas ESA Program intensification efforts: Ventura County Star media coverage. Additional coverage through five local ethnic media round table events on assistance programs. 11

")


")