Correlation Analysis of Volcanic SO2 Emissions and Temperature Anomaly
During large volcanic eruptions with VEI>3, significant amounts of SO2 are emitted, leading to sulfate aerosol formation in the stratosphere. This study examines the correlation between volcanic SO2 emissions and global temperature anomalies using data from NASA's Goddard Institute for Space Studies. The analysis reveals a slight coherence between SO2 emissions and temperature decrease, with a lag of 1-2 years. However, other factors such as anthropogenic greenhouse gas emissions may contribute to temperature variations.

Download Presentation

Please find below an Image/Link to download the presentation.
The content on the website is provided AS IS for your information and personal use only. It may not be sold, licensed, or shared on other websites without obtaining consent from the author.If you encounter any issues during the download, it is possible that the publisher has removed the file from their server.
You are allowed to download the files provided on this website for personal or commercial use, subject to the condition that they are used lawfully. All files are the property of their respective owners.
The content on the website is provided AS IS for your information and personal use only. It may not be sold, licensed, or shared on other websites without obtaining consent from the author.
E N D
Presentation Transcript
Correlation Analysis of Volcanic SO2 Emissions and Temperature Anomaly EAS 4480 TERM PROJECT BY: MARCUS MORRIS
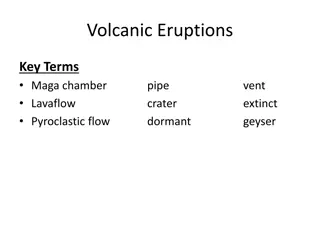
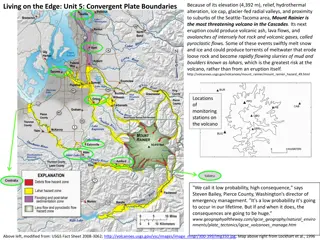
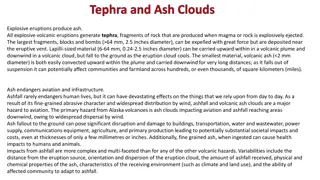
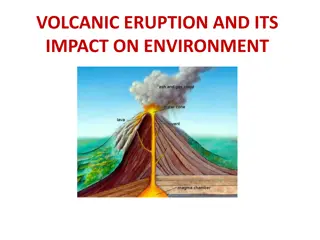
Introduction and Background During large eruptions (VEI>3) volcanic eruptions can deposit large amounts of SO2 SO2can last several weeks in the stratosphere, during which sulfate aerosols are formed which reflect incoming solar radiation Reduction in incoming solar radiation results in global cooling Hypothesis: There is a correlation between SO2deposited from volcanic eruptions and the resultant decrease in global average temperature compared to the long-term average
Data Data retrieved from NASA s Goddard Institute for Space Studies Date Range: 1979-2021 Global Scale Preliminary Analysis Correlation Coefficient: r= 0.065, [-0.24, 0.36] P-value: p=0.68, p>0.05 so correlation is not significant
Cross-Spectral Analysis Cross-spectral analysis gives a period of 8.6 years ( =8.6 yr) f=1/ , Frequency: 0.1163 Lag: -68.3 Negative lag indicates the temperature response occurs after the SO2emissions T=-1.6 years Coherence: 0.33
Cross Covariance Cross-covariance measures the similarity between one dataset and lagged copies of a second dataset The maximum negative covariance occurs at a period of 6 years
Conclusion There is a slight correlation (coherence=0.33) between SO2 emissions from volcanic eruptions and the subsequent decrease in global temperature with a time lag of 1-2 years Other factors that contribute to changes in temperature anomaly (i.e. anthropogenic GHG emissions) may explain the low coherence


![Read⚡ebook✔[PDF] Io After Galileo: A New View of Jupiter's Volcanic Moon (Sprin](/thumb/21612/read-ebook-pdf-io-after-galileo-a-new-view-of-jupiter-s-volcanic-moon-sprin.jpg)