Correlation and Simple Linear Regression in Social Research Methods
In this module, learn how to analyze the strength and direction of relationships between interval variables using correlation coefficients. Explore hypothesis formulation, significance tests, and interpretation with real-world examples. Discover the nuances of linear relationships and apply these concepts to practical scenarios. Dive into the principles of data analysis and understand the significance of correlations in research methods.

Uploaded on Mar 09, 2025 | 0 Views
Download Presentation

Please find below an Image/Link to download the presentation.
The content on the website is provided AS IS for your information and personal use only. It may not be sold, licensed, or shared on other websites without obtaining consent from the author.If you encounter any issues during the download, it is possible that the publisher has removed the file from their server.
You are allowed to download the files provided on this website for personal or commercial use, subject to the condition that they are used lawfully. All files are the property of their respective owners.
The content on the website is provided AS IS for your information and personal use only. It may not be sold, licensed, or shared on other websites without obtaining consent from the author.
E N D
Presentation Transcript
Quantitative Data Analysis II: Correlation and Simple Linear Regression SI0030 Social Research Methods Week 6 Luke Sloan
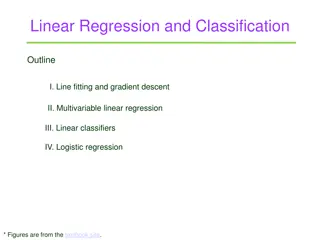
Introduction Last Week Recap Correlation How To Draw A Line Simple Linear Regression Summary
Last Week - Recap Hypotheses Probability & Significance (p=<0.05) Chi-square test for two categorical variables t-test for one categorical and one interval variables What about a test for two interval variables?...
Correlation I Calculates the strength and direction of a linear relationship between two interval variables e.g. is there a relationship between age and income? Measured using the Pearson correlation coefficient (r) Data must be normally distributed (check with a histogram) If not normally distributed use Spearman s Rank Order Correlation (rho) - consult Pallant (2005:297)
Correlation II r can take any value from +1 to -1 +/- indicates whether the relationship is positive or negative +1 or -1 is a perfect linear relationship, but usually it is not this clear cut Rule of thumb: +/- 0.7 = a strong linear relationship +/- 0.5 = a good linear relationship +/- 0.3 = a linear relationship Below +/- 0.3 = weak linear relationship 0 = no linear relationship Alternatively: - +/- 0.10 to 0.29 = weak - +/- 0.30 to 0.49 = medium - +/- 0.50 to 1.00 - strong
Correlation III No relationship No Relationship Negative relationship Relationship Negative Positive Positive relationship Relationship Formulate hypotheses and use scatter plots!
Correlation IV H1 = There is a relationship between Age and the number of years a candidate has been a member of a political party H0 = There is no relationship between Age and the number of years a candidate has been a member of a political party What do you think?
Correlation V Is this normal? Just to prove a point
Correlation VI Perfect correlation against itself (obviously!) and number of cases in analysis Correlations What was your age last birthday Number of years a party member ** What was your age last birthday Pearson Correlation Sig. (2-tailed) 1 .425 .000 N Pearson Correlation Sig. (2-tailed) 4481 .425 .000 1874 ** Number of years a party member 1 N 1874 1936 **. Correlation is significant at the 0.01 level (2-tailed). Significance for correlation is problematic (highly dependent on sample size) report p-value but ignore level of significance Pearson s Correlation Coefficient is r=0.43 medium/good positive linear relationship
Correlation VII Don t forget to refute or accept the null hypothesis and discuss the relationship Correlation is not causation! The relationship between the number of years a candidate has been a member of a party and candidate age was explored using Pearson s correlation coefficient. Both variables were confirmed to have normal distributions [?] and a scatter plot revealed a linear relationship. There was a medium-strength, positive relationship between the two variables (r=0.43, n=4481, p<0.05)... [go on to explain the relationship in detail]
How To Draw A Line I Correlation is indicative of a relationship, but it does not allow us to quantify it The line of best fit is a predictive it is the regression line! What if we wanted to explain how an increase in age leads to an increase in years of party membership? What if we wanted to predict years of party membership based only on age?
How To Draw A Line II The regression line allows us to predict any given value of y when we know x i.e. if we know the age of a candidate we can predict how long they are likely to have been a member of a political party Another (more useful!) example would be years in education and income Using a regression line we can predict someone s income based on the number of years they have been in education Assumes a causal relationship that income is caused by years in education
How To Draw A Line III But we don t simply look very closely at the line and the axis of the scatter plot because the regression line can be written as an equation: y = a + bx b represents the slope of the line (the association between y & x ) e.g. how income changes in relation to education x represents the independent variable (what we are using to predict y ) e.g. years in education a represents the intercept(where the regression line crosses the vertical y axis) aka the constant y represents the dependent variable (what we are trying to predict) e.g. income
How To Draw A Line IV y = 0 + 2x y = 0 + 1x y axis y = 0 + 0.5x What about y = 0 + 0.25x y = 1 + 1x x axis
Simple Linear Regression If we know the slope (b) and the intercept (a), for any given value of x we can predict y EXAMPLE: predicting income (y) in thousands ( ) from years in education (x) Preconditions: Equations: Intercept (a) = 4 y = a + bx Or Slope (b) = 1.5 Income = intercept + (slope*years in education) For someone with 10 years of education Or Income = 4 + (1.5*10) = 19 ( 19,000)
Simple Linear Regression II Assumptions Interval level data Linearity between x and y Outliers (check scatter plot) Sample size = 100+? R2measure of model fit Literally the Pearson s correlation coefficient squared R2 tells us how much of the variance in the dependent variable is explained by the independent variable e.g. how much of the variance in income can be explained by age Expressed as a percentage (1.0 = 100%, 0.5 = 50% etc)
Simple Linear Regression III H0 = There is no relationship between Age and the number of years a candidate has been a member of a political party H1 = There is a relationship between Age and the number of years a candidate has been a member of a political party H2 = As the age of a candidate increases, so will the number of years that they have been a party member Years as Party Member = intercept + (slope * Age )
Simple Linear Regression IV Pearson s correlation coefficient (same value!) 18% of variance in party membership (y) explained by age (x) Model Summary Model Std. Error of the Estimate R R Square Adjusted R Square a 1 .425 .181 .180 11.995 a. Predictors: (Constant), What was your age last birthday This tests the hypothesis that the model is a better predictor of party membership than if we simply used the mean value of party membership p<0.05 so the regression model is a significantly better predictor than the mean value ANOVAb Model Sum of Squares 59446.085 269339.696 df Mean Square 59446.085 143.878 F Sig. a 1 Regression Residual 1 413.170 .000 1872 Total 328785.781 1873 a. Predictors: (Constant), What was your age last birthday b. Dependent Variable: Number of years a party member
Simple Linear Regression V y = a + bx p<0.05 so Age has a significant effect on Party Membership This is the intercept (a) This is the slope (b) Coefficientsa Model Standardiz ed Coefficient s Beta Unstandardized Coefficients B -6.899 Std. Error t Sig. .000 1 (Constant) What was your age last birthday 1.156 -5.966 .418 .021 .425 20.327 .000 a. Dependent Variable: Number of years a party member A one unit increase in age will result in an increase in party membership of 0.42 Party Membership = -6.9 + (0.42 * Age ) Or
Simple Linear Regression VI and this is what we saw in the original scatter plot! The regression line will intercept the verticle (y) axis at -6.9 The regression line rises by 0.42 on the verticle axis (y) for every one unit increase on the horizontal axis (x) The R2 value is low because of the fanning effect (remember the histograms!)
Summary How to describe and quantify the relationship between two interval variables Correlation the strength and direction of the association Regression the causal and quantified effect of an independent on a dependent variable