Correlation Between Leaf Length and Width
Investigate the relationship between the length and width of water plant leaves using scatter graphs and analyze correlations. Discover patterns such as positive correlation where leaves get wider as they grow longer. Predict leaf dimensions and understand how variables relate in natural growth processes.

Download Presentation

Please find below an Image/Link to download the presentation.
The content on the website is provided AS IS for your information and personal use only. It may not be sold, licensed, or shared on other websites without obtaining consent from the author.If you encounter any issues during the download, it is possible that the publisher has removed the file from their server.
You are allowed to download the files provided on this website for personal or commercial use, subject to the condition that they are used lawfully. All files are the property of their respective owners.
The content on the website is provided AS IS for your information and personal use only. It may not be sold, licensed, or shared on other websites without obtaining consent from the author.
E N D
Presentation Transcript
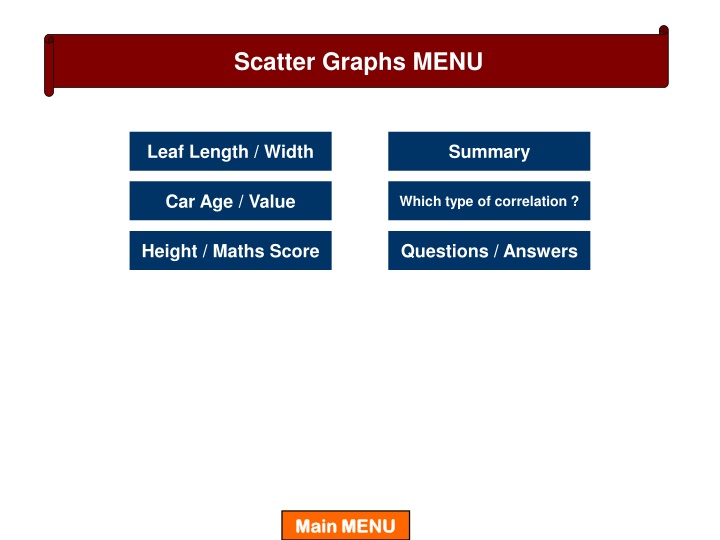
Scatter Graphs MENU Leaf Length / Width Summary Leaf Length / Width Summary Car Age / Value Which type of correlation ? Car Age / Value Which type of correlation ? Height / Maths Score Questions / Answers Height / Maths Score Questions / Answers Main MENU Main MENU Main MENU
S catter Gr a phs. S catter Gr a phs. Menu Menu
If I measure their lengths measure their widths see if there is a correlation I could then draw a Scatter Graph to I wonder if water plant leaves grow wider as they grow longer. between the length and the width of water plant leaves. and then Menu Menu
L 6 20 10 2 18 12 14 9 8 15 23 16 17 25 W 5 15 9 1 14 11 14 7 7 11 17 13 12 18 X W X L X 15 cm The plots are in a sort of straight line ! I can therefore draw in a Line Of Best Fit. X X X X X X How long would you expect a 10 cm wide leaf to be ? How wide would you expect a 19 cm long leaf to be ? Positive Correlation As one quantity increases so does the other. The line slopes from bottom left to top right. X X X As the leaves get longer they also get wider. X X 12.8 cm Menu Menu
I wonder if there is a connection between the age of a car and its value. Menu Menu
A 1 5 14 7 11 7 6 10 2 10 9 14 4 8 V 9 6 1 5 3 6 8 4 9 3 5 2 7 6 x How old should a car be when it is worth 7000 ? I will just ignore it ! As one quantity increases the other decreases. Value Decreases. It s an OUTLIER. How much should an 8 year old car be worth ? The line slopes from top left bottom right. X X Negative Correlation As the Age increases, the X X X X X X X X 5100 X X X X 5 years Menu Menu
I think that tall people are better at Maths than short people ! No way ! Menu Menu
% 10 30 90 50 30 70 60 50 20 85 55 35 40 H 180 160 170 170 140 145 150 175 140 155 150 150 145 That is because there is no I don t seem to be able to draw in a Line of Best Fit ! correlation ! X X X X X X X X X X X X X Menu Menu
SUMMARY X X X X X X X X X X X X X X X X X X X X X X X X X X X X Strong Positive Correlation Strong Negative Correlation No Correlation x x x x x x x x x x x x x Ignore Outliers x x x x x x x x Weak Positive Correlation Weak Negative Correlation Menu Menu
Which type of Correlation ? 1) 2) Score in Maths Exam 3) Weight Height Negative Correlation x x x x x x x x x x x x Positive Correlation x No x x Correlation x x x x x x Score in Art Exam Hours Spent Exercising Weight 4) Life 5) Shot Put Distance 6) Maths Exam Mark Expectancy x x x x Negative Correlation x x x x x x x Positive Correlation x x Positive Correlation x x x x x x x Hours Spent Revising Time for 100 m Cigarettes Smoked per Day Menu Menu
Plot the following data on Scatter Graphs and use their Lines Of Best Fit to answer the questions. 1) Thirteen students recorded their Maths and Science scores as follows : Maths % 90 45 72 24 55 83 42 12 36 66 82 25 30 Science % 85 52 68 30 58 87 35 8 41 70 74 30 41 a) What would you expect a student who got 77 % in Maths to get in Science ? b) What would you expect a student who got 50 % in Science to get in Maths ? Answer c) Describe the type of Correlation. Answer 2) Twelve pupils had their Maths results recorded against the number of days absent from school : Maths % 60 20 90 60 30 80 33 96 48 50 10 62 Days absent 10 25 10 23 25 10 30 40 25 20 35 16 a) How many days absent would you expect a pupil to have had who scored 40 % in their Maths exam ? b) What Maths score would you predict for a pupil who has had 15 days of absence ? Answer Answer c) Describe the Correlation. Menu Menu
Science % a) 77 % in Maths 77 % in Science 90 x x 80 b) 50 % in Science 47 % in Maths. x x 70 x 60 x c) Positive Correlation. x x 50 x x 40 x x 30 20 10 x Maths % 0 0 10 20 30 40 50 60 70 80 90 100 Menu Questions Menu Questions
a) 40 % in Maths 24 days absent. Days Absent 40 x b) 15 days absent 63 % in Maths. x 35 x 30 c) Negative Correlation. x x x 25 x 20 x x 15 x x x 10 5 Maths % 0 0 10 20 30 40 50 60 70 80 90 100 Menu Questions Menu Questions
End of Scatter Graphs Presentation. Return to previous slide. End of Scatter Graphs Presentation. Return to previous slide.


 40 % in Maths")