Cost Analysis and F&A Rate Proposal at Harvard
Delve into the intricacies of cost analysis, F&A rate proposal, and the F&A process at Harvard University. Explore the essential functions, calculations, and significance of F&A within the institution. Discover key figures and variances in F&A rates at Harvard.

Download Presentation

Please find below an Image/Link to download the presentation.
The content on the website is provided AS IS for your information and personal use only. It may not be sold, licensed, or shared on other websites without obtaining consent from the author. If you encounter any issues during the download, it is possible that the publisher has removed the file from their server.
You are allowed to download the files provided on this website for personal or commercial use, subject to the condition that they are used lawfully. All files are the property of their respective owners.
The content on the website is provided AS IS for your information and personal use only. It may not be sold, licensed, or shared on other websites without obtaining consent from the author.
E N D
Presentation Transcript
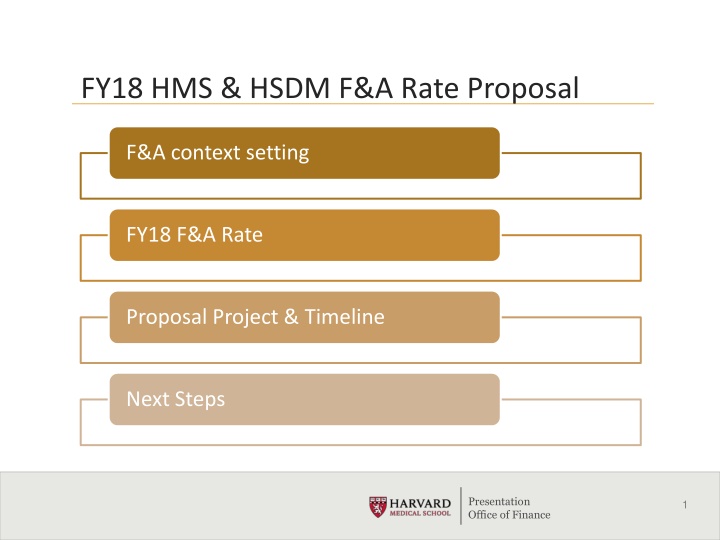
FY18 HMS & HSDM F&A Rate Proposal F&A context setting FY18 F&A Rate Proposal Project & Timeline Next Steps Presentation Office of Finance 1
What else does Cost Analysis do? Brian Kimball Grace Shin COST ANALYSIS Ensure maximum F&A rate! Understanding our Costs F&A Proposal Review calculation of service center rates Low IDC Review cost of space Review lab occupancy Research Density Service Centers Review PI research $$$ Review indirect cost recovery Monitor inventory of assets Equipment Review low IDC budgets Presentation Office of Finance 2
What and When is the F&A process? with Federal CAS CALCULATED F&A 73.17% NEGOTIATED F&A 69.5% Presentation Office of Finance 3
Who does F&A at HARVARD (UNIV IDC GROUP)? in CRIS UN RATE = 69.0% UN Comprehensive Rate Information System created by vendor, Maximus (FAS) CS Wyss HMS WI RATE (UN) = 69.0% WI RATE (LW) = 88.5% HM RATE = 69.5% (Central - OSP) SPH PH RATE = 59.5% Presentation Office of Finance 4
High level review of F&A calculation ~$700M in Annual EXPENSES OTHER OTHER SPONSORED ACTIVITY INSTRUCTION ORGANIZED RESEARCH INSTITUTIONAL ACTIVITY Higher Education has 4 major functions. Presentation Office of Finance 5
What does F&A mean to HMS? ~$75M in Annual REVENUE, 1 pt. is approximately worth $1M NEGOTIATED FY09 Calculated FY18 Calculated VARIANCE General Admin 9.05 9.74 +0.69 Dept Admin 16.14 17.05 +0.91 Spon Proj Admin 5.68 6.16 +0.48 Calculated Admin Total 30.87 32.95 +2.08 Capped Admin Total 26.00 26.00 26.00 0.00 Build Dep 10.10 11.16 7.89 -3.27 Equip Dep 3.90 4.13 4.52 +0.39 Interest 5.90 6.47 1.36 -5.11 Oper & Maintenance 19.60 21.33 26.08 +4.75 Library 2.70 2.76 5.55 +2.79 Utility Allocation 1.30 1.30 0.85 -0.45 Calculated Facilities Total 43.50 47.16 46.25 -0.91 TOTAL 69.50 73.16 72.25 -0.91 Presentation Office of Finance 6
Changes since last proposal NEGOTIATED FY09 Calculated FY18 Calculated VARIANCE General Admin 9.05 9.74 +0.69 Dept Admin 16.14 17.05 +0.91 Spon Proj Admin 5.68 6.16 +0.48 Calculated Admin Total 30.87 32.95 +2.08 Capped Admin Total 26.00 26.00 26.00 0.00 Build Dep 10.10 11.16 7.89 -3.27 Equip Dep 3.90 4.13 4.52 +0.39 Interest 5.90 6.47 1.36 -5.11 Oper & Maintenance 19.60 21.33 26.08 +4.75 Library 2.70 2.76 5.55 +2.79 Utility Allocation 1.30 1.30 0.85 -0.45 Calculated Facilities Total 43.50 47.16 46.25 -0.91 TOTAL 69.50 73.16 72.25 -0.91 Presentation Office of Finance 7
Lost ~8.9 points since FY09 Proposal Building Depreciation No major construction projects NRB components reached useful life IMPACT Lost ~3.5 points Refinance of initial NRB construction loan by Treasury Management in FY17 IMPACT Lost ~5.0 points Interest Utility Allowance Change in federal rules require schools to calculate utility usage in research labs IMPACT Lost ~0.4 points Presentation Office of Finance 8
What we did in FY18 NEGOTIATED FY09 Calculated FY18 Calculated VARIANCE General Admin 9.05 9.74 +0.69 Dept Admin 16.14 17.05 +0.91 Spon Proj Admin 5.68 6.16 +0.48 Calculated Admin Total 30.87 32.95 +2.08 Capped Admin Total 26.00 26.00 26.00 0.00 Build Dep 10.10 11.16 7.89 -3.27 Equip Dep 3.90 4.13 4.52 +0.39 Interest 5.90 6.47 1.36 -5.11 Oper & Maintenance 19.60 21.33 26.08 +4.75 Library 2.70 2.76 5.55 +2.79 Utility Allocation 1.30 1.30 0.85 -0.45 Calculated Facilities Total 43.50 47.16 46.25 -0.91 TOTAL 69.50 73.16 72.25 -0.91 Presentation Office of Finance 9
Gain 8 points Exponential growth in need and complexity of resources IMPACT Gain 5 points IT Infrastructure Restructuring of Library IMPACT Gain 3 points Centralized Library Presentation Office of Finance 10
F&A Team Brian Kimball Grace Shin COST ANALYSIS FACILITIES ORA HCCM IT HMS CENTRAL UNITS DENTAL DRY LABS WET LABS SCIENCE DEPTS UN (FAS) SPH WYSS CS HARVARD UNIV IDC GROUP (OSP-Central) EXTERNAL F&A CONSULTANTS MAXIMUS HURON ATTAIN Presentation Office of Finance 11
F&A Project and Timeline HAR IDC Grp Consultants Science Dept Cost Analysis HMS Central (FY17) Understand HCCM costs, space, per diem, census, and internal subsidy with HCCM (FY17) New Cost Analysis Team, Grace Shin & Brian Kimball (FY17) Improve Internal Equipment System, Apex with HMS IT (FY17) Practice F&A rate in CRIS with Maximus FY17 (FY18) Leverage and Develop Internal People and Space tracking system, PINS F&A with IT (FY17) Develop Strategic plan for FY18 F&A calculation, HMS Finance (FY17,18) Review Organized Research Base with ORA (FY18) Monitor Equipment Inventory, Apex with HMS Science Depts and Dental FY18 (FY18) Review and Refine data load and reporting out of PINS F&A with HMS IT, Facilities, & Science Depts and Dental (FY18) Review and Identify IT Costs supporting RESEARCH with HMS IT and Huron (FY17,18,19) Collaborate and Calculate F&A rate with Harvard UNIV IDC group (FY18) Conduct Space Survey with HMS Science Depts and Dental FY19 (FY19) Review and Refine Rate and Indirect Cost Proposal with HARVARD UNIV IDC group (FY18,19) Model Different Scenarios, Cost Analysis (FY18,19) Review F&A Proposal with Attain (FY19) Submit to Federal CAS, Cost Analysis Presentation Office of Finance 12
Whats Next? Submission DS-2 update & Projections Submit by Mar. 31 Data Request & Site Visit Submitted on Fri 3/29/19 to CAS-NY office. By June 2019 Update DS-2 (disclosure statement on Accounting practices) and provide Projections on investments in RES. Fall 2019 - Spring 2020 1) CAS will do a desk review and ask for more data 2) CAS will schedule a site visit, interview with selected PI Labs. Presentation Office of Finance 13


?")