COVID-19 Pandemic Implications on P/C Insurance Industry Financial Overview
Explore the financial impact of COVID-19 on the Property/Casualty (P/C) insurance industry, including net income trends, Return on Equity (ROE) dynamics, and influences from major events. Gain insights on the industry's resilience amid economic downturns and the pandemic's broader implications.

Download Presentation

Please find below an Image/Link to download the presentation.
The content on the website is provided AS IS for your information and personal use only. It may not be sold, licensed, or shared on other websites without obtaining consent from the author. If you encounter any issues during the download, it is possible that the publisher has removed the file from their server.
You are allowed to download the files provided on this website for personal or commercial use, subject to the condition that they are used lawfully. All files are the property of their respective owners.
The content on the website is provided AS IS for your information and personal use only. It may not be sold, licensed, or shared on other websites without obtaining consent from the author.
E N D
Presentation Transcript
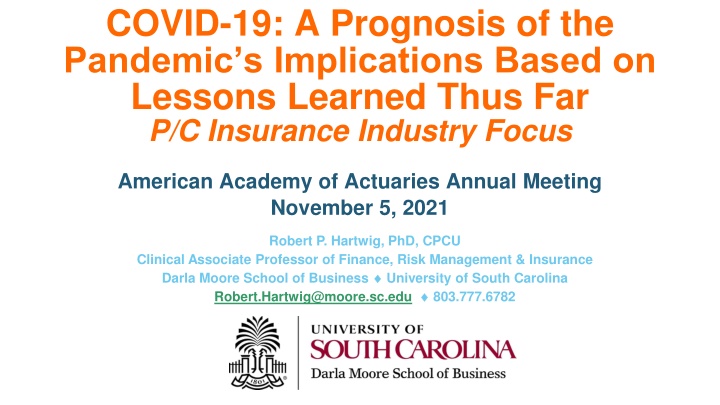
COVID-19: A Prognosis of the Pandemic s Implications Based on Lessons Learned Thus Far P/C Insurance Industry Focus American Academy of Actuaries Annual Meeting November 5, 2021 Robert P. Hartwig, PhD, CPCU Clinical Associate Professor of Finance, Risk Management & Insurance Darla Moore School of Business University of South Carolina Robert.Hartwig@moore.sc.edu 803.777.6782
P/C Insurance Industry: Financial Overview Amid the COVID-19 Pandemic The P/C Insurance Industry Entered the COVID-19 Pandemic from a Position of Financial Strength Industry Remains Strong 2 2
P/C Industry Net Income After Taxes, 19912021:H1* 2005 ROE= 9.6% 2006 ROE = 12.7% 2007 ROE = 10.9% 2008 ROE = 0.1% 2009 ROE = 5.0% 2010 ROE = 6.6% 2011 ROAS1 = 3.5% 2012 ROAS1 = 5.9% 2013 ROAS1 = 10.2% 2014 ROAS1 = 8.4% 2015 ROAS = 8.4% 2016 ROAS = 6.2% 2017 ROAS =5.0% 2018 ROAS = 8.0% 2019: ROAS = 7.7% 2020: ROAS = 6.8% 2021: ROAS = 8.3%* $24,404 $ Millions $80,000 $65,777 $63,784 $63,032 $62,496 $60,700 $56,826 $70,000 $55,870 $60,000 $44,155 $42,924 $38,501 $38,000 $36,819 $36,813 $50,000 $35,204 $33,522 $30,773 $30,029 $28,672 $40,000 $21,865 $20,598 $20,559 $19,456 $19,316 $30,000 $14,178 $10,870 $20,000 $5,840 COVID s impact on net income was more modest than anticipated, a decline of 3.7% $3,046 $3,043 $10,000 $0 -$6,970 -$10,000 91 92 93 94 95 96 97 98 99 00 01 02 03 04 05 06 07 08 09 10 11 12 13 14 15 16 17 18 20 21* *2021 is through H1. ROE figures are GAAP; 1Return on avg. surplus. Excludes Mortgage & Financial Guaranty insurers for years (2009-2014). Sources: A.M. Best, ISO, APCIA.
ROE: Property/Casualty Insurance by Major Event, 1987 2021:H1* (Percent) P/C Profitability Is Influenced Both by Cyclicality and Volatility 20% Katrina, Rita, Wilma Harvey, Irma, Maria, CA Wildfires Low CATs 15% 2021* 8.3% 10% Sept. 11 Hugo 5% Lowest CAT Losses in 15 Years Sandy 4 Hurricanes 2020 6.8% Covid-19 Andrew, Iniki Financial Crisis* ROE fell by 8.3 pts from 12.7% to 4.4% 0% Record Tornado Losses Northridge -5% 87 88 89 90 91 92 93 94 95 96 97 98 99 00 01 02 03 04 05 06 07 08 09 10 11 12 13 14 15 16 17 18 19 20 21* *Excludes Mortgage & Financial Guarantee in 2008 2014. 2021 figure is H1 actual of 8.3%. Sources: ISO, Fortune, APCIA; USC RUM Center. 4
Percentage Point Change in P/C ROEs During Past Economic Downturns: 1971 - Present Change in P/C ROE During Past Economic Downturns (pre-Covid) Avg.: -4.5% (-4.0% ex. 2000-01) Median: -5.0% (-3.0% ex. 2000-01) Percentage Point Change 2.0% 0.8% 0.0% -1.1% -2.0% -2.4% -3.0% -4.0% COVID-19 s economic and financial market impact helped drive down industry ROEs but by less than in a typical recession -6.0% -7.0% -7.1% -8.0% -8.3% -10.0% 2007-08 2000-01* 1973-75 1981-82 1979-80 2019-20 1990-91 *2000-2001 decline impacted by 9/11 losses. Source: USC Center for Risk and Uncertainty Management. 5
Policyholder Surplus (Capacity), 2006:Q4 2020:Q4E and 2021F* ($ Billions) $1,050 Financial Crisis (-16.2%) The P/C insurance industry entered the COVID-19 pandemic from a position of strength and was able to withstand the 9.0% surplus decline in Q1 2020 (far less than during the Financial Crisis). 2020 ended with record surplus. 2021 will likely set another new record, reaching $1 trillion for the first time. $990.0 Drop due to near-record 2011 CAT losses (-4.9%) $1,000 $898.5 $950 $865.1 $847.8 $900 $819.7 $812.2 $802.2 $850 $781.5 $779.5 $771.9 $750.7 $742.1 $800 $717.0 $700.9 $750 $676.3 $662.0 $673.9 $675.2 $674.2 $671.6 $673.7 $653.4 $700 $624.4 $614.0 $607.7 $650 $586.9 $583.5 $566.5 $570.7 $567.8 $559.2 $559.1 $550.3 $544.8 $600 $540.7 $538.6 $530.5 $521.8 $517.9 $515.6 $512.8 $511.5 $505.0 $496.6 $490.8 $550 $487.1 $478.5 $463.0 $455.6 $500 $437.1 $450 $400 06:Q4 07:Q1 07:Q2 07:Q3 07:Q4 08:Q1 08:Q2 08:Q3 08:Q4 09:Q1 09:Q2 09:Q3 09:Q4 10:Q1 10:Q2 10:Q3 10:Q4 11:Q1 11:Q2 11:Q3 11:Q4 12:Q1 12:Q2 12:Q3 12:Q4 13:Q1 13:Q2 13:Q3 13:Q4 14:Q1 14:Q2 14:Q3 14:Q4 15:Q2 15:Q4 16:Q1 16:Q4 17:Q2 17:Q4 18:Q3 18:Q4 19:Q1 19:Q2 19:Q3 19:Q4 20:Q1 20:Q2 20:Q3 20:Q4 2021F Policyholder Surplus is the industry s financial cushion against large insured events, periods of economic stress and financial market volatility. It is also a source of capital to underwrite new risks. 2010: Q1 data includes $22.5B of paid-in capital from a holding company parent for one insurer s investment in a non- insurance business. *2021 figures is actual through H1. Sources: ISO, A.M .Best; Risk and Uncertainty Management Center, University of South Carolina. 6
Net Premium Growth (All P/C Lines): Annual Change, 1971 2021F 2021F: 4.6%* 2020: 1.8% 2020:Q3: 3.1% 2019: 3.6% 2018: 10.8% 2017: 4.6% 2016: 2.7% 2015: 3.5% 2014: 4.2 2013: 4.4% 2012: +4.2% (Percent) 1984-87 1975-78 2000-03 25% Net Written Premiums Fell 0.7% in 2007 (First Decline Since 1943) by 2.0% in 2008, and 4.2% in 2009, the First 3- Year Decline Since 1930-33. 20% 15% 10% 2020 Outlook Pre-COVID: 3.8% Actual: 1.8%** 5% 0% -5% 71 72 73 74 75 76 77 78 79 80 81 82 83 84 85 86 87 88 89 90 91 92 93 94 95 96 97 98 99 00 01 02 03 04 05 06 07 08 09 10 11 12 13 14 15 16 17 18 19 20 21F * **Pre/Post-COVID-19 forecast from A.M. Best Review & Preview (Feb. 2020, 2021). NOTE: Shaded areas denote hard market periods Sources: A.M. Best (1971-2013, 2021F), ISO (2014-19); Risk & Uncertainty Management Center, Univ. of South Carolina
COVIDs Impact on NPW Growth for Largest P/C Lines: 2020 Personal Auto insurers returned $8B to policyholders in 2020, but net change in NPW was just $4.2B (same as WC) Percent Change Workers Comp, Inland Marine and PP Auto Liability have experienced the largest decline in DPW 15% 13.1% 9.9% 10% 6.1% 4.1% 5% 2.3% 2.3% 0% -1.7% -2.2% -5% -10% Down $4.2B -10.0% -15% Workers Comp Inland Marine* Pvt. Pass. Auto Liab Commercial Auto All Lines Homeowners Fire & Allied Other Liability All Other Lines (incl. IM) *Inland Marine figure is DPW though first 9-months of 2020 (A.M. Best). Sources: NAIC Annual Statement data, NCCI; Risk and Uncertainty Management Center, Univ. of South Carolina. 8
P/C Insurance Industry Combined Ratio, 20012021F** Pre-COVID 2020 Combined Ratio Est. 99.1 (A.M. Best) Actual = 98 Relatively Low CAT Losses, Reserve Releases As Recently as 2001, Insurers Paid Out Nearly $1.16 for Every $1 in Earned Premiums Higher CAT Losses, Shrinking Reserve Releases, Toll of Soft Market Relatively Low CAT Losses, Reserve Releases Sharply higher CATs are driving large underwriting losses and pricing pressure Heavy Use of Reinsurance Lowered Net Losses 120 Avg. CAT Losses, More Reserve Releases 115.8 COVID-19 has had no discernable net impact on pre-COVID expectations for the combined ratio in 2020; -7.5 pts. due to CATs vs. 4.1 in 2019 (about twice avg.) Lower CAT Losses Cyclical Deterioration Best 110 Combined Ratio Since 1949 (87.6) 107.5 106.5 Sandy Impacts 103.7 102.5 101.1 101.0 100.8 100.7 99.2 100.1 99.8 98.9 99.3 98.4 100 98.0 96.497.097.8 95.7 92.6 90 01 02 03 04 05 06 07 08 09 10 11 12 13 14 15 16 17 18 19 20** 21** *Excludes Mortgage & Financial Guaranty insurers 2008 2014. **2021 forecast from A.M. Best Review and Preview (Feb. 2021). First-half actual = 96.9. Sources: A.M. Best, ISO (2014-2019).
Property/Casualty Insurance Industry Investment Income: 2000 2021F ($ Billions) $59.6 $60 $56.2 $54.6 $53.4 $52.3 $51.2 $49.5 $49.2$48.0$47.3$46.4$47.2$46.6 $48.9 $48.8 $50 $47.1$47.6 Investment income had just recovered from a decade-long slump. Aggressive Fed actions and recession are pushing interest rates lower and will adversely impact investment income for years to come. $39.6 $38.9 $38.7 $40 $37.1$36.7 $30 00 01 02 03 04 05 06 07 08 09 10 11 12 13 14 15 16 17 18* 19 20 21F Due to persistently low interest rates, investment income remained below pre-crisis levels for a decade. Lower interest rates post-COVID will drive investment income down once again. *2021 figure is YTD Q1 actual figure of $12.189B. 2018-19 figures are distorted by provisions of the TCJA of 2017. Increase reflects such items as dividends from foreign subsidiaries. 1 Investment gains consist primarily of interest and stock dividends. Sources: ISO; University of South Carolina, Center for Risk and Uncertainty Management.
Net Investment Yield on Property/Casualty Insurance Invested Assets, 2007 2021:H1 (Percent) Investment yields remained depressed-- down about 150 BP from pre-crisis levels. COVID-19 Fed rate cuts, bond purchases have pushed asset yields down 5.0 4.64.5 4.6 4.4 4.5 4.2 4.0 3.9 3.73.8 4.0 3.7 3.7 3.4 3.4 3.5 3.3 3.23.1 3.1 3.1 3.0 3.0 2.5 03 04 05 06 07 08 09 10 11 12 13 14 15 16 17 18 19 20 21:H1 The yield on invested assets remains low relative to pre- crisis yields. Fed rate increases beginning in late 2015 through 2018 halted the slide in yields, but rate cuts in 2019/2020 have adversely impacted recent gains Average: 1960-2019 = 4.9% Low: 2.8% (1961) High: 8.2% (1984/85) Sources: NAIC data, sourced from S&P Global Market Intelligence; 2017-19 figures are from ISO. 2020-21 data from the APCIA. Risk and Uncertainty Management Center, Univ. of South Carolina.
The Economy Drives P/C Insurance Industry Premiums: 2006:Q1 2021:H1* Direct Premium Growth (All P/C Lines) vs. Nominal GDP: Quarterly Y-o-Y Pct. Change 8% DWP y-o-y change y-o-y nominal GDP growth +16.8% +8.9% 6% 4% 2% 0% Premium growth slowed in 2020 due to the COVID recession, but nowhere near as much as the economy overall -2% -4% -6% 2008:Q1 2008:Q3 2009:Q1 2009:Q3 2010:Q1 2010:Q3 2011:Q1 2011:Q3 2012:Q1 2012:Q3 2013:Q1 2013:Q3 2014:Q1 2014:Q3 2015:Q1 2015:Q3 2016:Q1 2016:Q3 2017:Q1 2017:Q3 2018:Q1 2018:Q3 2019:Q1 2019:Q3 2020 2021:H1 Direct written premiums track nominal GDP fairly tightly over time, suggesting the P/C insurance industry s growth prospects inextricably linked to economic performance. *2020 figure is annual. Sources: SNL Financial; U.S. Commerce Dept., Bureau of Economic Analysis; ISO; I.I.I.; Risk and Uncertainty Management Center, University of South Carolina.
Payroll vs. Workers Comp Net Written Premiums, 1990 2020* Payrolls in 2020 YTD showed virtually zero growth (+0.2%) vs. +4.9% in 2019 Payroll Base* $Billions WC NWP $Billions Wage & Salary Disbursements WC NPW $10,000 $50 12/07-6/09 3/01-11/01 7/90-3/91 $9,000 $45 WC premium volume dropped two years before the recession began $8,000 $7,000 $40 WC premiums written fell sharply from $42 to $38B (-10%) in 2020, revealing the typical pattern of a elastic response for WC NPW $6,000 $35 $5,000 WC net premiums written were down $14B or 29.3% to $33.8B in 2010 after peaking at $47.8B in 2005 $4,000 $30 $3,000 $2,000 $25 90 92 94 96 98 00 02 04 06 08 10 12 14 16 18 20* Continued payroll growth will benefit WC exposure growth, but falling rates will adversely impact growth in Net Written Premiums *Private employment as of Dec. 2020; Shaded areas indicate recessions. WC premiums are from NCCI through 2020. Private carriers only. Sources: NBER (recessions); Federal Reserve Bank of St. Louis at http://research.stlouisfed.org/fred2/series/WASCUR;NCCI.
COVID WC Claims: NCCI Data Should Modest Impacts NCCI estimates total COVID WC costs through the end of the pandemic at ~$500M for the 38 states in which they serve. For all 50 states plus self- insureds, the number is likely closer to $1 billion or more Most claims were low severity, with average severity = $6,000 in 2020 Source: NCCI Financial Call through 12/31/20. Indemnity and Medical Paid+Case Losses 14
COVID WC Claim Distribution Most claims WC COVID claims were lost-time and originating with healthcare workers and first responsers Source: NCCI Financial Call through 12/31/20. Indemnity and Medical Paid+Case Losses 15
Inflationary Pressures Impacting Insurers Claim Inflation Is Here Today Rate and Reserve Adequacy Are Concerns if Current Inflationary Trends Persist 16
U.S. Inflation Rate: 2009-2023F* Inflation accelerated sharply in 2021 though should decelerate in 2022 and beyond making the case for a Fed rate hike more remote (Fed is looking to keep long-run inflation rate ~2%) There s a great deal of concern that trillions of dollars of stimulus plus the post-COVID recovery, supply chain disruptions and labor shortages are causing the economy to overheat, resulting in inflation Percentage Change (%) 5.0% 4.5% 4.2% 4.0% 3.2% 3.0% 2.4% 2.1% 2.1% 1.8% 1.8% 2.0% 1.6% 1.6% 1.5% 1.3% 1.2% 1.0% 0.1% 0.0% Insurer Concerns About Inflation Rate Inadequacy Reserve Inadequacy -0.4% -1.0% 09 10 11 12 13 14 15 16 17 18 19 20 21F 22F 23F *Annual change in Consumer Price Index for All Urban Consumers (CPI-U). Source: U.S. Bureau of Labor Statistics; Wells Fargo Securities (10/21); USC Center for Risk and Uncertainty Management.
PPIs for Construction and Selected Inputs Cumulative change in PPIs, June 2020 -June 2021 (not seasonally adj.) % Change June 2020- June 2021: 120% Rapid increase in costs for many categories of construction inputs 100% Lumber and plywood Steel mill products 101% Demand surge from Ida and other events could pressure construction material prices 88% 80% Copper and brass mill shapes 61% 60% 40% Aluminum mill shapes 33% Plastic construction products Gypsum products 22% 20% 18% 0% Bid price (new nonres building construction) 6/21 3.4% -20% 3/21 4/21 5/21 2/21 9/20 6/20 7/20 8/20 1/21 12/20 10/20 11/20 Source: Associated General Contractors from Bureau of Labor Statistics, producer price indexes, www.bls.gov/ppi
US Auto Claim Frequency Trends Significantly Impacted by COVID but Severities Rise: 12 Months Ending Q1 2021 Year-over-Year Change Frequency Severity 20% 13.4% 12.4% 15% 10.8% 9.6% 10% 2.5% 5% 0% -5% -10% -15% -12.1% -20% -25% -21.8% -23.9% -25.0% -30% -35% -32.0% Prop. Damage Liability PIP Collision Bodily Injury Liability Comprehensive Auto Claims Fell Sharply During the Pandemic, though Claim Severities Rose Materially PD Liability claims plunged by nearly 1/3 Source: ISO/PCI Fast Track data for Q1 2021; Risk and Uncertainty Management Center, Univ. of South Carolina. 19
COVID-19 Litigation Update Court Decisions Have Largely Favored Insurers, but Concerns Remain 20 20
Weekly Number of COVID-Related Lawsuits Filed: (Weeks Ending Mar. 16, 2020 to Sept. 27, 2021) [Latest Available] The number of new cases remains far below 2020 highs with just 3 filed the week ending Sept. 27, 2021. Cumulative Total = 2,038 79 59 3 Source: Covid Coverage Litigation Tracker, University of Pennsylvania School of Law. Accessed 11/3/21 at: https://cclt.law.upenn.edu 21
COVID Litigation: Merits Rulings on Motions to Dismiss: Federal vs. State Courts (Total through July 26, 2021) [Latest Available] Federal Courts State Courts Full Dismissal With Prejudice: 63 Insurers have won full dismissals in 95% of federal court cases involving Covid Insurers have won full dismissals in 70% of state court cases involving Covid Source: Covid Coverage Litigation Tracker, University of Pennsylvania School of Law. Accessed 9/1/21 at: https://cclt.law.upenn.edu 22
Thank you for your time and your attention! Twitter: twitter.com/bob_hartwig For a copy of this presentation, email me at robert.hartwig@moore.sc.edu or Download at www.uscriskcenter.com 23


,")
:")