Cox Proportional Hazards Modeling for Cardiovascular Events and Heart Failure
Explore the results of univariate and multivariate Cox proportional hazards models for cardiovascular events, sudden death, and heart failure risks. The analysis includes hazard ratios, confidence intervals, and significant predictors like age, gender, eGFR, and more.

Download Presentation

Please find below an Image/Link to download the presentation.
The content on the website is provided AS IS for your information and personal use only. It may not be sold, licensed, or shared on other websites without obtaining consent from the author. If you encounter any issues during the download, it is possible that the publisher has removed the file from their server.
You are allowed to download the files provided on this website for personal or commercial use, subject to the condition that they are used lawfully. All files are the property of their respective owners.
The content on the website is provided AS IS for your information and personal use only. It may not be sold, licensed, or shared on other websites without obtaining consent from the author.
E N D
Presentation Transcript
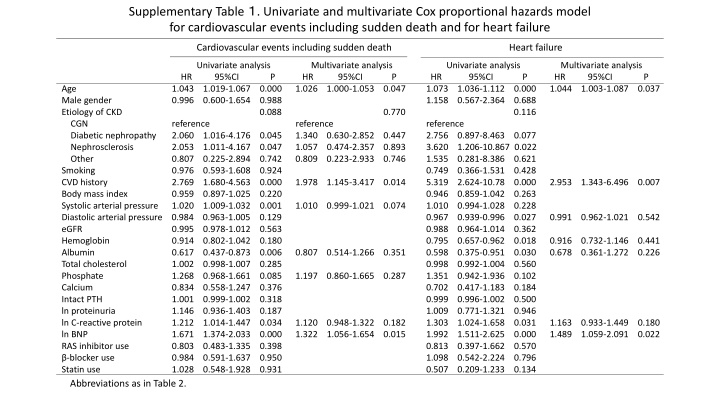
Supplementary Table . Univariate and multivariate Cox proportional hazards model for cardiovascular events including sudden death and for heart failure Cardiovascular events including sudden death Heart failure Univariate analysis Multivariate analysis HR 95%CI P HR 95%CI P 1.043 1.019-1.067 0.000 1.026 1.000-1.053 0.047 0.996 0.600-1.654 0.988 0.088 reference reference 2.060 1.016-4.176 0.045 1.340 0.630-2.852 0.447 2.053 1.011-4.167 0.047 1.057 0.474-2.357 0.893 0.807 0.225-2.894 0.742 0.809 0.223-2.933 0.746 0.976 0.593-1.608 0.924 2.769 1.680-4.563 0.000 1.978 1.145-3.417 0.014 0.959 0.897-1.025 0.220 1.020 1.009-1.032 0.001 1.010 0.999-1.021 0.074 Diastolic arterial pressure 0.984 0.963-1.005 0.129 eGFR 0.995 0.978-1.012 0.563 Hemoglobin 0.914 0.802-1.042 0.180 Albumin 0.617 0.437-0.873 0.006 0.807 0.514-1.266 0.351 Total cholesterol 1.002 0.998-1.007 0.285 Phosphate 1.268 0.968-1.661 0.085 1.197 0.860-1.665 0.287 Calcium 0.834 0.558-1.247 0.376 Intact PTH 1.001 0.999-1.002 0.318 ln proteinuria 1.146 0.936-1.403 0.187 ln C-reactive protein 1.212 1.014-1.447 0.034 1.120 0.948-1.322 0.182 ln BNP 1.671 1.374-2.033 0.000 1.322 1.056-1.654 0.015 RAS inhibitor use 0.803 0.483-1.335 0.398 -blocker use 0.984 0.591-1.637 0.950 Statin use 1.028 0.548-1.928 0.931 Abbreviations as in Table 2. Univariate analysis Multivariate analysis HR 95%CI P HR 95%CI P 1.073 1.036-1.112 0.000 1.044 1.003-1.087 0.037 1.158 0.567-2.364 0.688 0.116 reference 2.756 0.897-8.463 0.077 3.620 1.206-10.867 0.022 1.535 0.281-8.386 0.621 0.749 0.366-1.531 0.428 5.319 2.624-10.78 0.000 2.953 1.343-6.496 0.007 0.946 0.859-1.042 0.263 1.010 0.994-1.028 0.228 0.967 0.939-0.996 0.027 0.991 0.962-1.021 0.542 0.988 0.964-1.014 0.362 0.795 0.657-0.962 0.018 0.916 0.732-1.146 0.441 0.598 0.375-0.951 0.030 0.678 0.361-1.272 0.226 0.998 0.992-1.004 0.560 1.351 0.942-1.936 0.102 0.702 0.417-1.183 0.184 0.999 0.996-1.002 0.500 1.009 0.771-1.321 0.946 1.303 1.024-1.658 0.031 1.163 0.933-1.449 0.180 1.992 1.511-2.625 0.000 1.489 1.059-2.091 0.022 0.813 0.397-1.662 0.570 1.098 0.542-2.224 0.796 0.507 0.209-1.233 0.134 Age Male gender Etiology of CKD CGN Diabetic nephropathy Nephrosclerosis Other Smoking CVD history Body mass index Systolic arterial pressure 0.770
Subgroup Number of events Hazard ratio (95% CI) P value for interaction 67 62/243 1.435 (1.202, 1.860) Age 0.734 <67 30/239 1.416 (1.073, 1.867) female 34/157 1.617 (1.215, 2.154) Sex 0.636 Male 58/325 1.492 (1.216, 1.830) CGN 15/110 2.157 (1.308, 3.557) DN 39/158 Etiology of CKD 1.221 (0.956, 1.560) 0.794 Nephrosclerosis 32/173 1.793 (1329, 2.418) Others 6/41 1.150 (0.590, 2.242) No 65/381 1.429 (1.165, 1.754) HF 0.764 Yes 27/101 1.513 (1.058, 2.165) 30 18/120 1.566 (1.083, 2.264) 15, <30 35/211 eGFR 1.548 (1.175, 2.640) 0.747 <15 39/151 1.444 (1.119, 1.865) 1.0 2.0 3.0
Heart failure Cardiovascular events Number of events P value for interaction Number of events P value for interaction Hazard ratio (95% CI) Hazard ratio (95% CI) Subgroup 67 43/243 1.640 (1.261, 2.133) 1.981 (1.387, 2.829) 25/243 0.875 0.841 Age <67 23/239 1.586 (1.156, 2.175) 1.867 (1.147, 3.040) 10/239 female 23/157 1.708 (1.204, 2.423) 2.135 (1.260, 3.619) 11/157 0.869 0.771 Sex male 43/325 1.657 (1.307, 2.101) 1.953 (1.413, 2.700) 24/325 CGN 11/110 2.142 (1.200, 3.825) 2.392 (0.889, 6.437) 4/110 DN 26/158 1.264 (0.936, 1.706) 1.635 (1.072, 2.494) 13/158 Etiology of CKD 0.780 0.863 Nephrosclerosis 26/173 2.116 (1.497, 2.991) 2.304 (1.452, 3.657) 16/173 Others 3/41 1.267 (0.529, 3.036) 1.807 (0.719, 4.545) 2/41 no 44/381 1.630 (1.276, 2.082) 2.145 (1.482, 3.103) 20/381 HF 0.089 0.559 Yes 22/101 1.455 (0.988, 2.142) 1.317 (0.823, 2.096) 15/101 30 14/120 1.762 (1.165, 2.667) 2.313 (1.305, 4.100) 8/120 15, <30 24/211 1.794 (1.278, 2.519) 1.664 (0.990, 2.799) 0.434 0.746 10/211 eGFR <15 28/151 1.433 (1.062, 1.932) 1.891 (1.273, 2.809) 17/151 1.0 2.0 3.0 4.0 5.0 6.0 1.0 2.0 3.0
Primary composite endpoint Cardiovascular events (including sudden death) P=0.176 vs lowest tertile Probability of survival Probability of survival P=0.006 vs lowest tertile P=0.059 vs middle tertile P=0.365 vs lowest tertile P=0.015 vs lowest tertile P=0.036 vs middle tertile lowest tertile middle tertile highest tertile Months from nephrology referral Lowest 33 32 31 28 24 20 17 1 0 Middle 57 55 52 47 38 30 22 4 0 Highest 72 65 57 46 40 28 23 2 0 Months from nephrology referral Lowest 33 32 31 28 24 20 18 1 0 Middle 57 55 52 47 38 30 22 4 0 Highest 72 65 57 46 40 28 23 2 0 Heart failure All-cause death P=0.607 vs lowest tertile P=0.025 vs lowest tertile P=0.016 vs middle tertile P=0.136 vs lowest tertile Probability of survival Probability of survival P=0.026 vs lowest tertile P=0.317 vs middle tertile Months from nephrology referral Lowest 33 33 32 29 26 22 18 1 0 Middle 57 55 53 50 44 35 27 5 0 Highest 72 68 66 55 47 33 26 3 0 Months from nephrology referral Lowest 33 33 33 30 26 22 18 1 0 Middle 57 56 54 51 44 36 28 5 0 Highest 72 71 70 62 53 35 28 4 0
Supplementary Figure 1. Subgroup analyses for primary composite endpoint stratified by age, sex, etiology of CKD, history of HF, and eGFR category. Unadjusted HRs were similar across subgroups. Abbreviations: CGN, chronic glomerulonephritis; CKD, chronic kidney disease; DN, diabetic nephropathy; eGFR, estimated glomerular filtration rate; HF, heart failure Supplementary Figure 2. Subgroup analyses for cardiovascular events including sudden death and for heart failure stratified by age, sex, etiology of CKD, history of HF, eGFR category. BNP was more predictive for heart failure in patients without a history of HF. Abbreviations as in Supplementary Figure 1 Supplementary Figure 3. Receiver operating characteristic curves for primary composite endpoint, CVEs including sudden death, HF and all-cause death in patients with echocardiography (n=162). Patients in the higher BNP groups had frequent episodes of the primary composite end point, CVEs including sudden death, HF and all-cause death.


